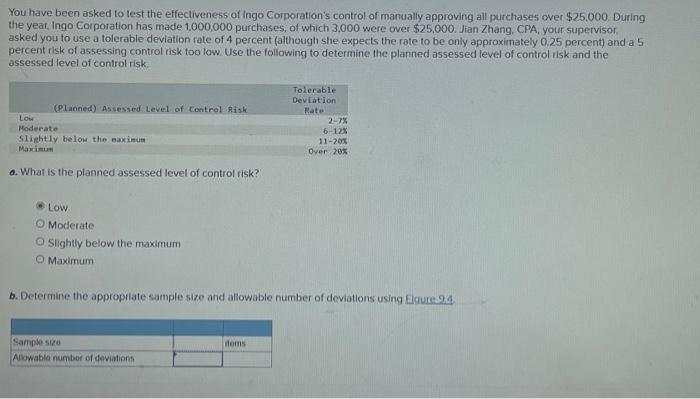
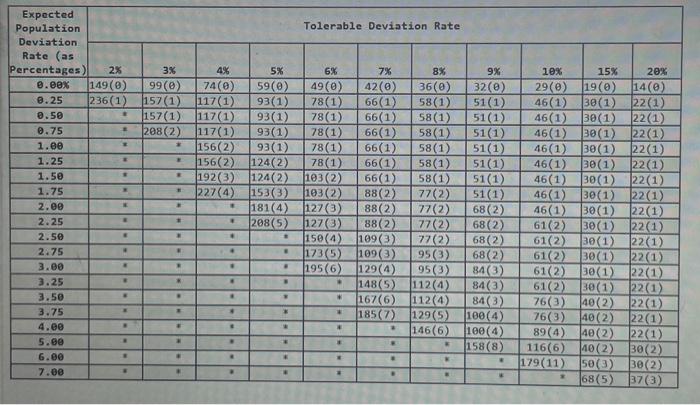
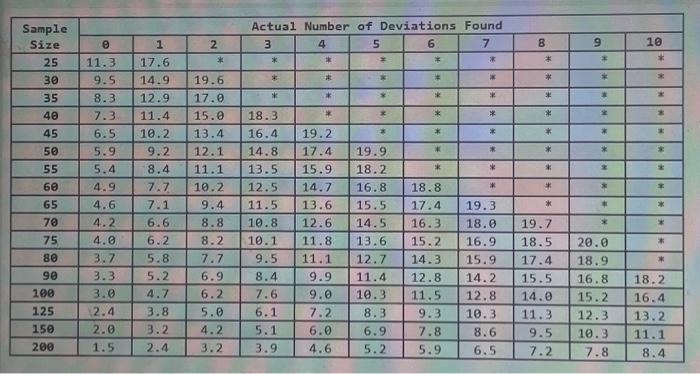
You have been asked to test the effectiveness of Ingo Corporation's control of manually approving all purchases over $25.000. During the year, Ingo Corporation has made 1,000,000 purchases, of which 3,000 were over $25,000. Jian Zhang, CPA, your supervisor. asked you to use a tolerable deviation rate of 4 percent (although she expects the rate to be only approximately 0.25 percent) and a 5 percent risk of assessing control risk too low. Use the following to determine the planned assessed level of control risk and the assessed level of control risk. o. What is the planned assessed level of control risk? Low Moderate Slightly below the maximum Maximum b. Determine the appropriate sample size and allowable number of deviations using Elqure. 94 \begin{tabular}{|c|c|c|c|c|c|c|c|c|c|c|c|} \hline \multirow{2}{*}{SampleSize} & \multicolumn{11}{|c|}{ Actual Number of Deviations Found } \\ \hline & & 1 & 2 & 3 & 4 & 5 & 6 & 7 & 8 & 9 & 10 \\ \hline 25 & 11.3 & 17.6 & * & * & * & * & * & & * & = & * \\ \hline 30 & 9.5 & 14.9 & 19.6 & * & & * & & & * & & * \\ \hline 35 & 8.3 & 12.9 & 17.0 & * & * & & & & * & & x \\ \hline 40 & 7.3 & 11.4 & 15.0 & 18.3 & & & * & * & * & & \\ \hline 45 & 6.5 & 10.2 & 13.4 & 16.4 & 19.2 & & * & & * & & \\ \hline 50 & 5.9 & 9.2 & 12.1 & 14.8 & 17.4 & 19.9 & * & * & & & * \\ \hline 55 & 5.4 & 8.4 & 11.1 & 13.5 & 15.9 & 18.2 & * & & & x & x \\ \hline 6 & 4.9 & 7.7 & 10.2 & 12.5 & 14.7 & \begin{tabular}{|l|} 16.8 \\ \end{tabular} & 18.8 & & & & \\ \hline 65 & 4.6 & 7.1 & 9.4 & 11.5 & 13.6 & 15.5 & 17.4 & 19.3 & & & * \\ \hline 70 & 4.2 & 6.6 & 8.8 & 10.8 & 12.6 & 14.5 & 16.3 & 18.0 & 19.7 & & \\ \hline 75 & 4.0 & 6.2 & 8.2 & 10.1 & 11.8 & 13.6 & 15.2 & 16.9 & 18.5 & 20.0 & * \\ \hline 80 & 3.7 & 5.8 & 7.7 & 9.5 & 11.1 & 12.7 & 14.3 & 15.9 & 17.4 & 18.9 & * \\ \hline 90 & 3.3 & 5.2 & 6.9 & 8.4 & 9.9 & 11.4 & 12.8 & 14.2 & 15.5 & 16.8 & 18.2 \\ \hline 160 & 3.0 & 4.7 & 6.2 & 7.6 & 9.0 & 10.3 & 11.5 & 12.8 & 14.0 & 15.2 & 16.4 \\ \hline 125 & 2.4 & 3.8 & 5.0 & 6.1 & 7.2 & 8.3 & 9.3 & 10.3 & 11.3 & 12.3 & 13.2 \\ \hline 150 & 2.0 & 3.2 & 4.2 & 5.1 & 6.0 & 6.9 & 7.8 & 8.6 & 9.5 & 10.3 & 11.1 \\ \hline 200 & 1.5 & 2.4 & 3.2 & 3.9 & 4.6 & 5.2 & 5.9 & 6.5 & 7.2 & 7.8 & 8.4 \\ \hline \end{tabular} c. Use Eigure 9.5 to determine the achieved upper deviation rate and the above table to determine the assessed level of control ris under the following circumstances. Assume that the sample size was 100 items. (Round your answers to 1 decimal place.) \begin{tabular}{|c|c|c|c|c|c|c|c|c|c|c|c|} \hline \multirow{2}{*}{ExpectedPopulationDeviationRate(asPercentages)} & \multicolumn{11}{|c|}{ Tolerable Deviation Rate } \\ \hline & 28 & 38 & 48 & 5% & 6% & 7% & 8x & 9x & 10% & 15% & 20x \\ \hline 0.00x & 149() & 99(8) & 74() & 59() & 49(0) & 42() & 36() & 32() & 29() & 19(0) & 14() \\ \hline 0.25 & 236(1) & 157(1) & 117(1) & 93(1) & 78(1) & 66(1) & 58(1) & 51(1) & 46(1) & 3(1) & 22(1) \\ \hline 0.50 & & 157(1) & 117(1) & 93(1) & 78(1) & 66(1) & 58(1) & 51(1) & 46(1) & 3(1) & 22(1) \\ \hline 0.75 & & 208(2) & 117(1) & 93(1) & 78(1) & 66(1) & 58(1) & 51(1) & 46(1) & 30(1) & 22(1) \\ \hline 1.00 & x & & 156(2) & 93(1) & 78(1) & 66(1) & 58(1) & 51(1) & 46(1) & 3(1) & 22(1) \\ \hline 1.25 & & & 156(2) & 124(2) & 78(1) & 66(1) & 58(1) & 51(1) & 46(1) & 30(1) & 22(1) \\ \hline 1.50 & & & 192(3) & 124(2) & 103(2) & 66(1) & 58(1) & 51(1) & 46(1) & 30(1) & 22(1) \\ \hline 1.75 & x & & 227(4) & 153(3) & 103(2) & 88(2) & 77(2) & 51(1) & 46(1) & 30(1) & 22(1) \\ \hline 2.00 & & & & 181(4) & 127(3) & 88(2) & 77(2) & 68(2) & 46(1) & 30(1) & 22(1) \\ \hline 2.25 & & & & 208(5) & 127(3) & 88(2) & 77(2) & 68(2) & 61(2) & 30(1) & 22(1) \\ \hline 2.50 & & & & & 150(4) & 109(3) & 77(2) & 68(2) & 61(2) & 30(1) & 22(1) \\ \hline 2.75 & & & & & 173(5) & 109(3) & 95(3) & 68(2) & 61(2) & 30(1) & 22(1) \\ \hline 3.00 & & & & & 195(6) & 129(4) & 95(3) & 84(3) & 61(2) & 30(1) & 22(1) \\ \hline 3.25 & & & & & . & 148(5) & 112(4) & 84(3) & 61(2) & 30(1) & 22(1) \\ \hline 3.50 & & & & & & 167(6) & 112(4) & 84(3) & 76(3) & 40(2) & 22(1) \\ \hline 3.75 & & & 5 & & & 185(7) & 129(5) & 100(4) & 76(3) & 40(2) & 22(1) \\ \hline 4.00 & & - & & & & 2 & 146(6) & 100(4) & 89(4) & 40(2) & 22(1) \\ \hline 5.60 & & & & & x & & & 158(8) & 116(6) & 40(2) & 30(2) \\ \hline 6.00 & & & & & & & & & 179(11) & 50(3) & 3(2) \\ \hline 7.00 & & & & & & & & & & 68(5) & 37(3) \\ \hline \end{tabular}


