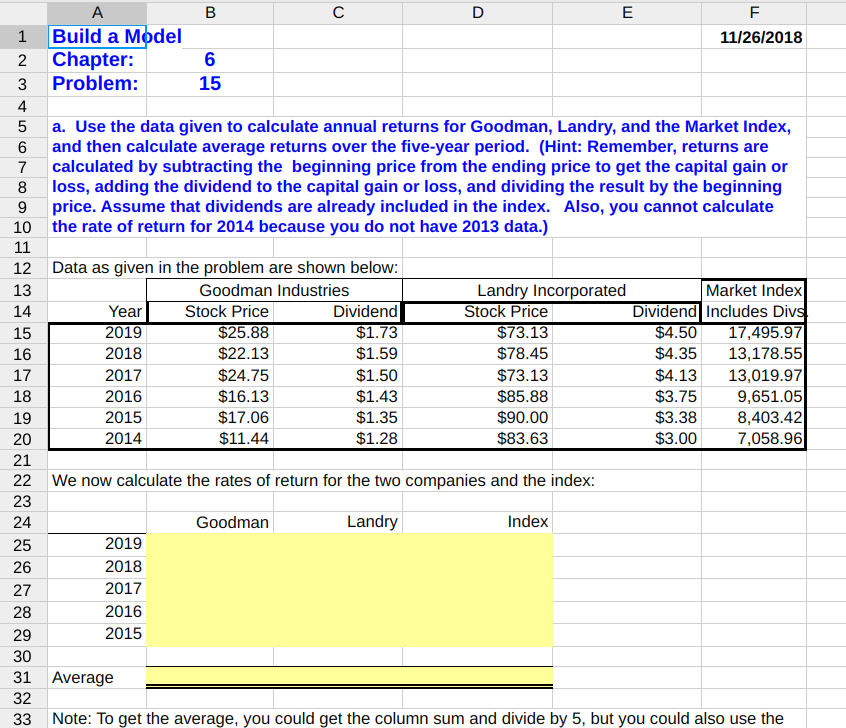
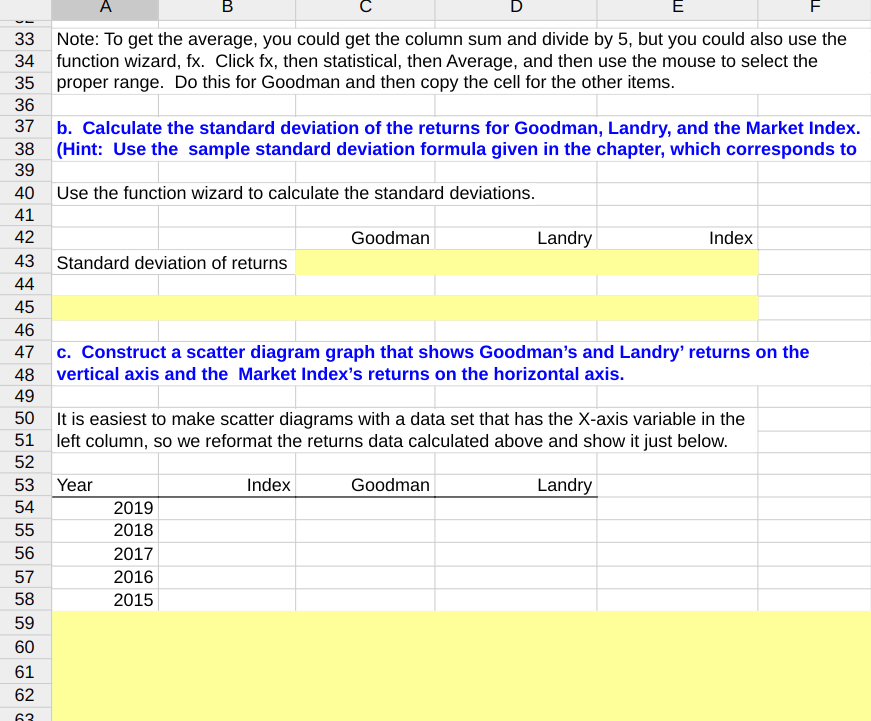
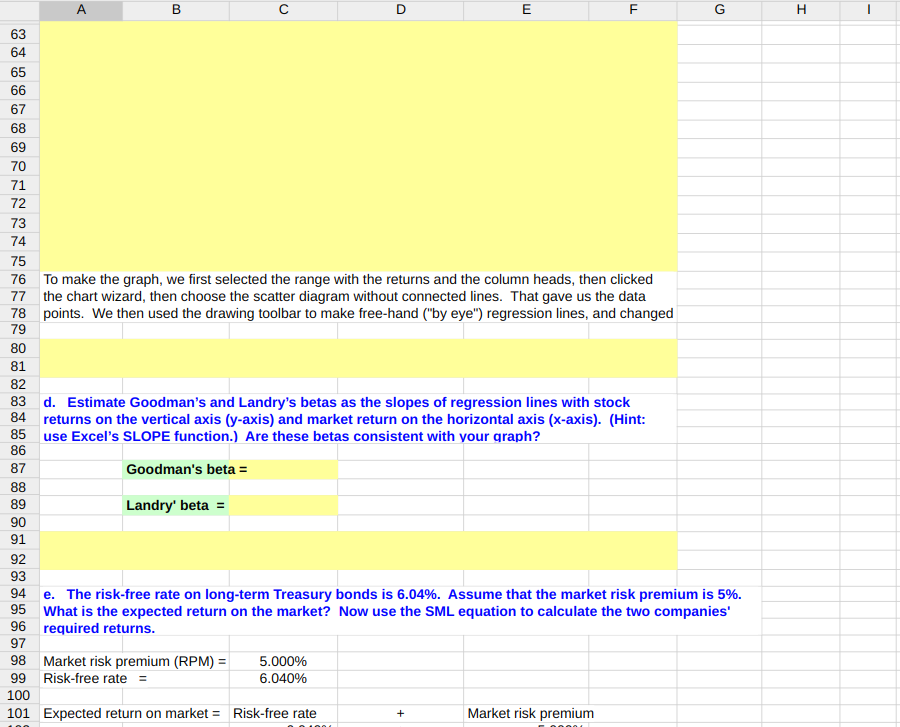
You have been hired to do some due diligence for a famous investor from Omaha who is interested in investing in one of two companies, Goodman or Landry Corp. The investor has given you Goodman Corporation's and Landry Incorporated's stock prices and dividends, along with the Market Index, in the attached spreadsheet. Stock prices are reported for December 31 of each year, and dividends reflect those paid during the year. The market data are adjusted to include dividends. You must use this data to compete the supplied models. Instructions: - Start with the partial model in the file Ch06 P15 Build a Model.xIsx. - Answer questions a-g within the workbook. 5 a. Use the data given to calculate annual returns for Goodman, Landry, and the Market Index, and then calculate average returns over the five-year period. (Hint: Remember, returns are calculated by subtracting the beginning price from the ending price to get the capital gain or loss, adding the dividend to the capital gain or loss, and dividing the result by the beginning price. Assume that dividends are already included in the index. Also, you cannot calculate the rate of return for 2014 because you do not have 2013 data.) 33 Note: To get the average, you could get the column sum and divide by 5 , but you could also use the 34 function wizard, fx. Click fx, then statistical, then Average, and then use the mouse to select the 35 proper range. Do this for Goodman and then copy the cell for the other items. 36 b. Calculate the standard deviation of the returns for Goodman, Landry, and the Market Index. 38 (Hint: Use the sample standard deviation formula given in the chapter, which corresponds to 40 Use the function wizard to calculate the standard deviations. \begin{tabular}{l|l|l|} \hline 41 & \\ 42 & & \\ 43 & Standard deviation of returns \\ 44 & & \\ 45 & & \end{tabular} c. Construct a scatter diagram graph that shows Goodman's and Landry' returns on the vertical axis and the Market Index's returns on the horizontal axis. 48 50 It is easiest to make scatter diagrams with a data set that has the X-axis variable in the 51 left column, so we reformat the returns data calculated above and show it just below. would be its beta and its required return? 120 would be its beta and its required return? 121 The beta of a portfolio is simply a weighted average of the betas of the stocks in the portfolio, so this portfolio's beta 123 would be: 124 Portfolio beta = g. Suppose an investor wants to include Goodman Industries' stock in his or her portfolio. Stocks A,B, and C are currently in the portfolio, and their betas are 0.769,0.985, and 1.423, respectively. Calculate the new portfolio's required return if it consists of 25% of Goodman, 15% of Stock A, 40% of Stock B, and 20% of Stock C. 'ortfolio Beta = You have been hired to do some due diligence for a famous investor from Omaha who is interested in investing in one of two companies, Goodman or Landry Corp. The investor has given you Goodman Corporation's and Landry Incorporated's stock prices and dividends, along with the Market Index, in the attached spreadsheet. Stock prices are reported for December 31 of each year, and dividends reflect those paid during the year. The market data are adjusted to include dividends. You must use this data to compete the supplied models. Instructions: - Start with the partial model in the file Ch06 P15 Build a Model.xIsx. - Answer questions a-g within the workbook. 5 a. Use the data given to calculate annual returns for Goodman, Landry, and the Market Index, and then calculate average returns over the five-year period. (Hint: Remember, returns are calculated by subtracting the beginning price from the ending price to get the capital gain or loss, adding the dividend to the capital gain or loss, and dividing the result by the beginning price. Assume that dividends are already included in the index. Also, you cannot calculate the rate of return for 2014 because you do not have 2013 data.) 33 Note: To get the average, you could get the column sum and divide by 5 , but you could also use the 34 function wizard, fx. Click fx, then statistical, then Average, and then use the mouse to select the 35 proper range. Do this for Goodman and then copy the cell for the other items. 36 b. Calculate the standard deviation of the returns for Goodman, Landry, and the Market Index. 38 (Hint: Use the sample standard deviation formula given in the chapter, which corresponds to 40 Use the function wizard to calculate the standard deviations. \begin{tabular}{l|l|l|} \hline 41 & \\ 42 & & \\ 43 & Standard deviation of returns \\ 44 & & \\ 45 & & \end{tabular} c. Construct a scatter diagram graph that shows Goodman's and Landry' returns on the vertical axis and the Market Index's returns on the horizontal axis. 48 50 It is easiest to make scatter diagrams with a data set that has the X-axis variable in the 51 left column, so we reformat the returns data calculated above and show it just below. would be its beta and its required return? 120 would be its beta and its required return? 121 The beta of a portfolio is simply a weighted average of the betas of the stocks in the portfolio, so this portfolio's beta 123 would be: 124 Portfolio beta = g. Suppose an investor wants to include Goodman Industries' stock in his or her portfolio. Stocks A,B, and C are currently in the portfolio, and their betas are 0.769,0.985, and 1.423, respectively. Calculate the new portfolio's required return if it consists of 25% of Goodman, 15% of Stock A, 40% of Stock B, and 20% of Stock C. 'ortfolio Beta =