Answered step by step
Verified Expert Solution
Question
1 Approved Answer
You have been tasked with performing a full review of Bombardier's Financial Statements for the past 5 fiscal years and drawing conclusions about the company's
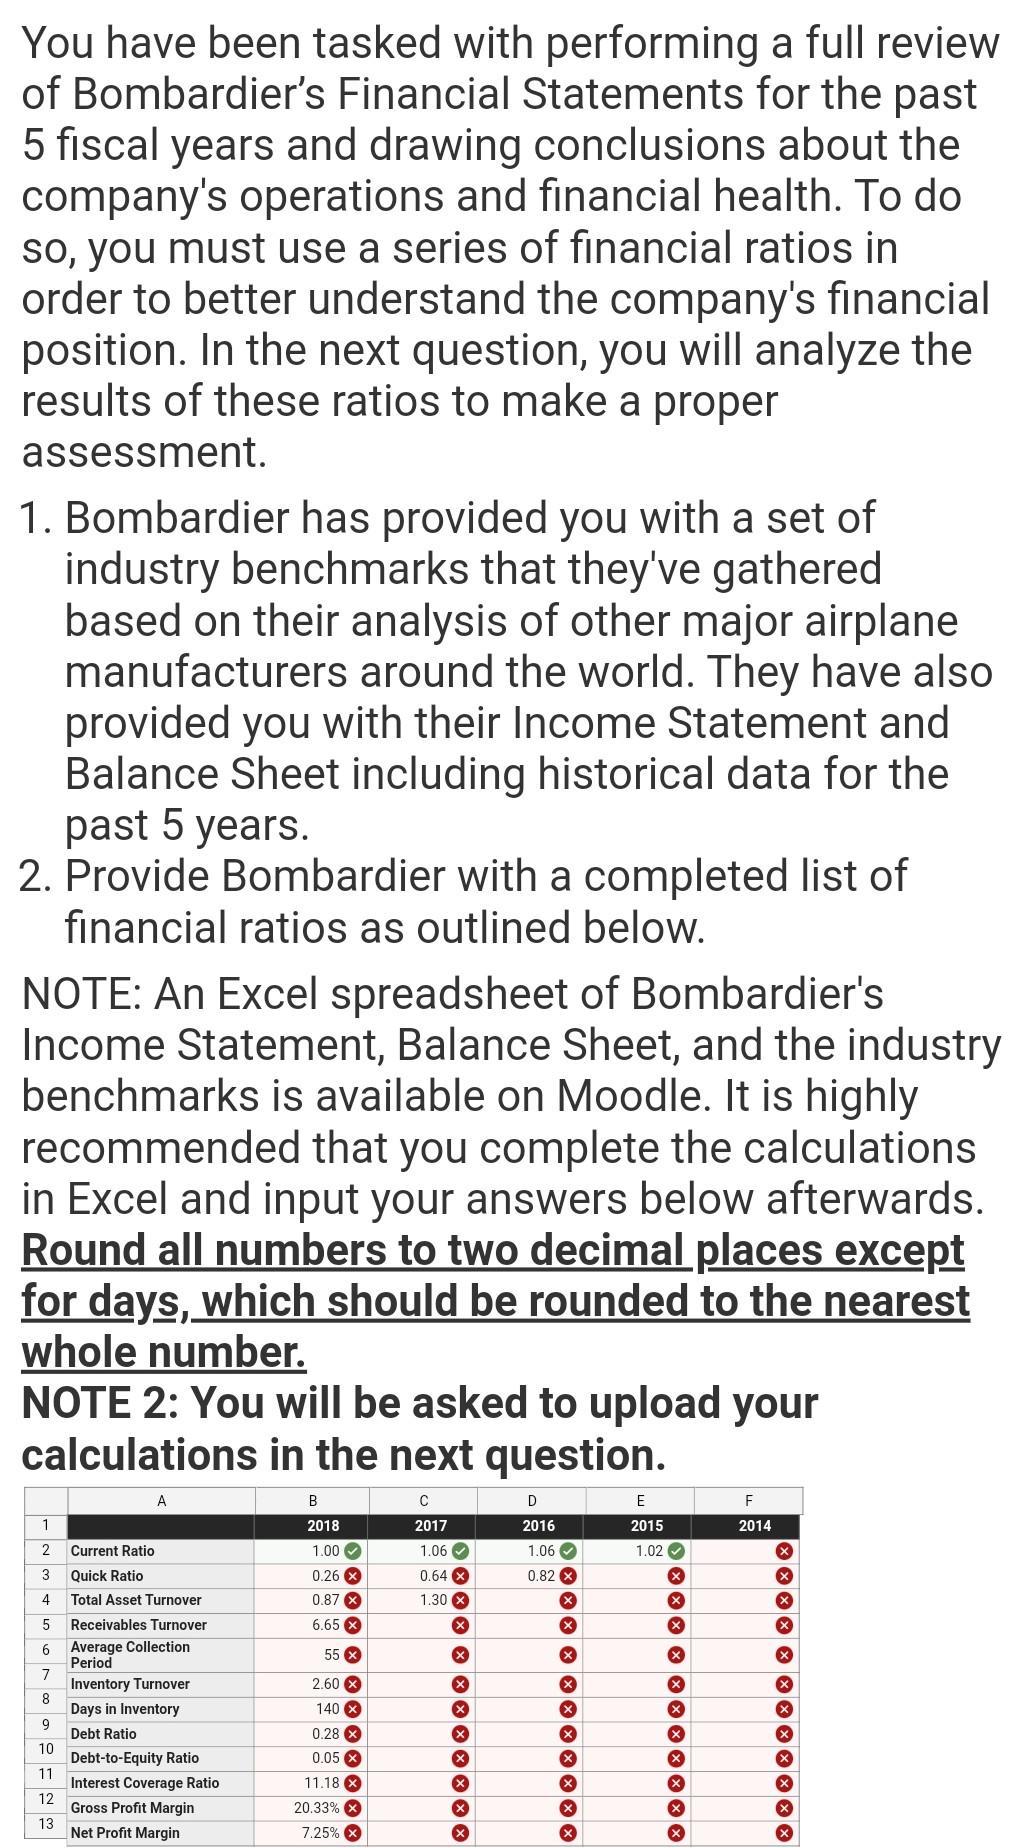
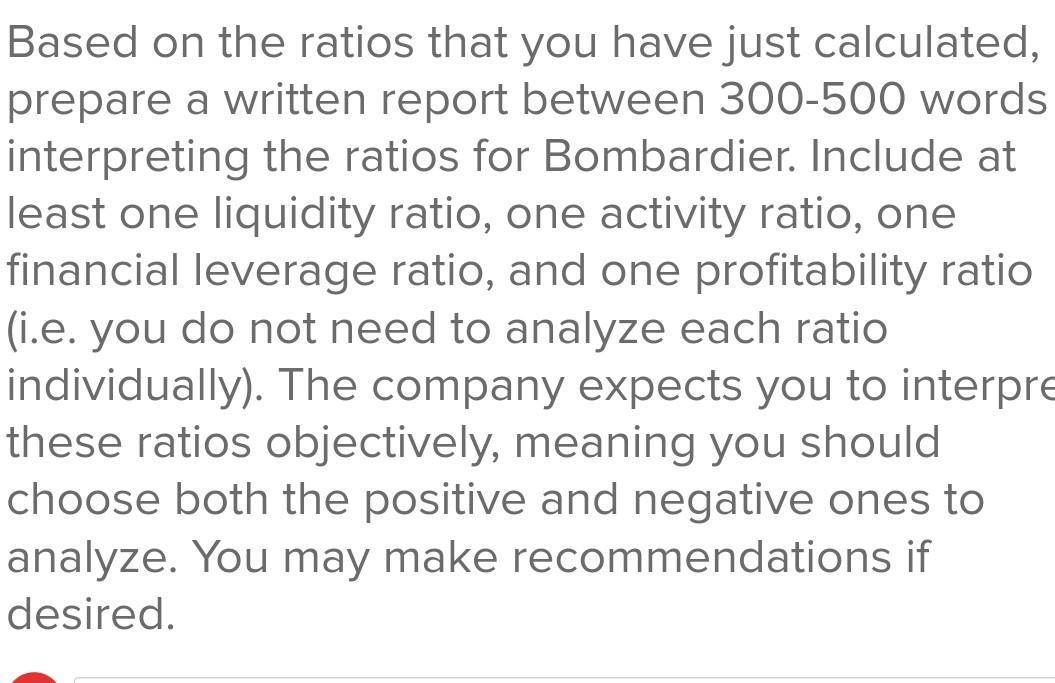
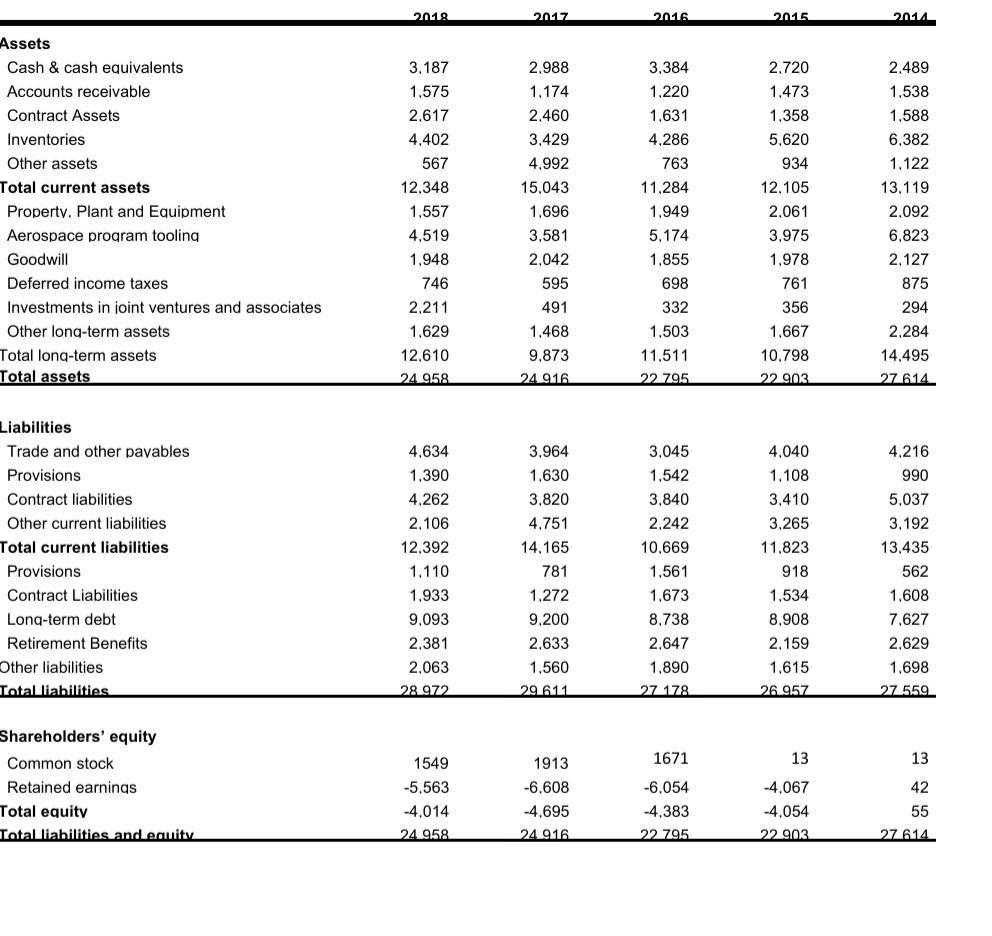
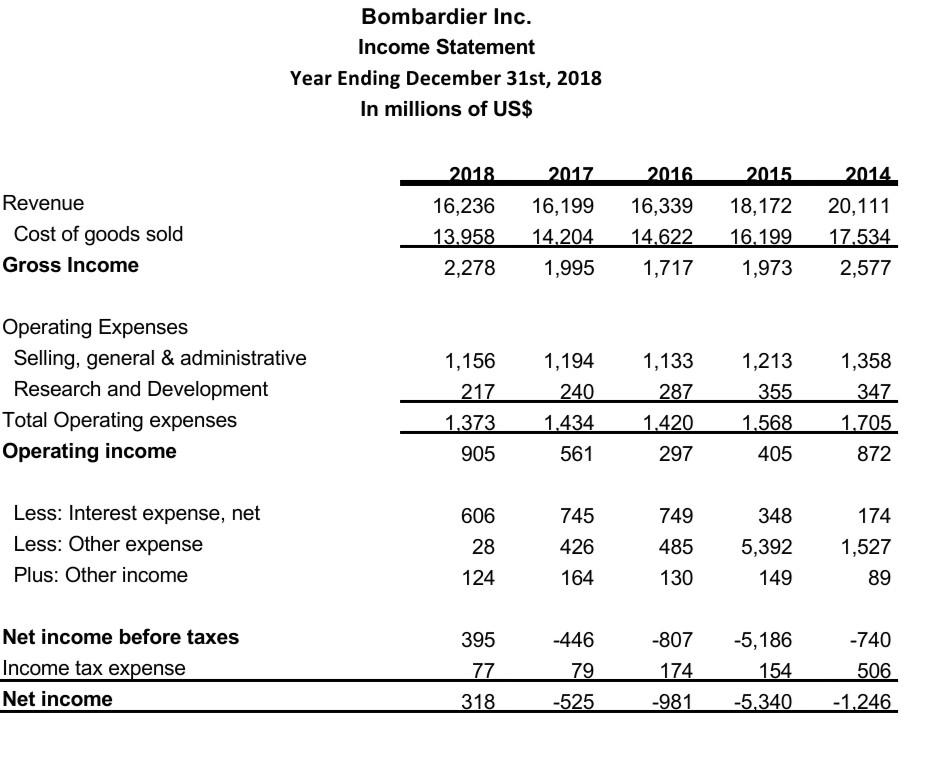
You have been tasked with performing a full review of Bombardier's Financial Statements for the past 5 fiscal years and drawing conclusions about the company's operations and financial health. To do so, you must use a series of financial ratios in order to better understand the company's financial position. In the next question, you will analyze the results of these ratios to make a proper assessment. 1. Bombardier has provided you with a set of industry benchmarks that they've gathered based on their analysis of other major airplane manufacturers around the world. They have also provided you with their Income Statement and Balance Sheet including historical data for the past 5 years. 2. Provide Bombardier with a completed list of financial ratios as outlined below. NOTE: An Excel spreadsheet of Bombardier's Income Statement, Balance Sheet, and the industry benchmarks is available on Moodle. It is highly recommended that you complete the calculations in Excel and input your answers below afterwards. Round all numbers to two decimal places except for days, which should be rounded to the nearest whole number. NOTE 2: You will be asked to upload your calculations in the next question. D B 2018 2017 1.06 E 2015 F 2014 1 2016 2 1.00 1.06 1.02 Current Ratio Quick Ratio 3 0.26 X 0.82 x 0.64 x 1.30 4 Total Asset Turnover 0.87 x X 5 6.65 X X x 6 55 X x x 7 x x 8 x x 9 Receivables Turnover Average Collection Period Inventory Turnover Days in Inventory Debt Ratio Debt-to-Equity Ratio Interest Coverage Ratio Gross Profit Margin Net Profit Margin x x x 10 2.60 X 140 X 0.28 X 0.05 X 11.18 X 20.33% X 7.25% x x 11 12 x 13 Based on the ratios that you have just calculated, prepare a written report between 300-500 words interpreting the ratios for Bombardier. Include at least one liquidity ratio, one activity ratio, one financial leverage ratio, and one profitability ratio (i.e. you do not need to analyze each ratio individually). The company expects you to interpre these ratios objectively, meaning you should choose both the positive and negative ones to analyze. You may make recommendations if desired. 2018 2017 2016 2015 2014 3,384 2.720 1.473 1.358 5,620 934 Assets Cash & cash equivalents Accounts receivable Contract Assets Inventories Other assets Total current assets Property. Plant and Equipment Aerospace program tooling Goodwill Deferred income taxes Investments in joint ventures and associates Other long-term assets Total long-term assets Total assets 3.187 1,575 2.617 4,402 567 12.348 1.557 4,519 1.948 746 2.211 1.629 12.610 24.958 2.988 1.174 2.460 3,429 4.992 15.043 1.696 3.581 2.042 595 1.220 1.631 4,286 763 11,284 1.949 5,174 1.855 2,489 1.538 1.588 6,382 1.122 13.119 2,092 6,823 2,127 875 12,105 2,061 3,975 1.978 761 356 1,667 10.798 698 332 294 491 1.468 9.873 24 916 1.503 11.511 22 795 2.284 14.495 27.614 22903 Liabilities Trade and other payables Provisions Contract liabilities Other current liabilities Total current liabilities Provisions Contract Liabilities Long-term debt Retirement Benefits Other liabilities Total liabilities 4.634 1.390 4,262 2,106 12.392 1.110 1,933 9.093 2.381 2.063 28.972 3.964 1.630 3.820 4.751 14.165 781 1.272 9,200 2,633 1.560 29 611 3.045 1,542 3,840 2,242 10.669 1.561 1,673 8.738 2.647 1,890 4.040 1.108 3.410 3,265 11.823 918 1.534 8,908 2.159 1.615 4,216 990 5,037 3,192 13.435 562 1.608 7.627 2.629 1.698 27.559 27 178 26.957 1549 1671 13 13 Shareholders' equity Common stock Retained earnings Total equity Total liabilities and equity 42 -5,563 -4.014 24.958 1913 -6.608 -4.695 24 916 -6,054 -4.383 22 795 -4.067 -4,054 22903 55 27 614 Bombardier Inc. Income Statement Year Ending December 31st, 2018 In millions of US$ 2017 2016 Revenue Cost of goods sold Gross Income 2018 16,236 13.958 2,278 16,199 14.204 1,995 16,339 14,622 1,717 2015 18,172 16.199 1,973 2014 20,111 17.534 2,577 Operating Expenses Selling, general & administrative Research and Development Total Operating expenses Operating income 1,213 355 1,156 217 1.373 905 1,194 240 1.434 561 1,133 287 1.420 297 1,358 347 1.705 872 1.568 405 606 745 348 Less: Interest expense, net Less: Other expense Plus: Other income 749 485 426 28 124 5,392 149 174 1,527 89 164 130 395 -807 -740 Net income before taxes Income tax expense Net income -446 79 77 174 -981 -5,186 154 -5,340 506 -1.246 318 -525 You have been tasked with performing a full review of Bombardier's Financial Statements for the past 5 fiscal years and drawing conclusions about the company's operations and financial health. To do so, you must use a series of financial ratios in order to better understand the company's financial position. In the next question, you will analyze the results of these ratios to make a proper assessment. 1. Bombardier has provided you with a set of industry benchmarks that they've gathered based on their analysis of other major airplane manufacturers around the world. They have also provided you with their Income Statement and Balance Sheet including historical data for the past 5 years. 2. Provide Bombardier with a completed list of financial ratios as outlined below. NOTE: An Excel spreadsheet of Bombardier's Income Statement, Balance Sheet, and the industry benchmarks is available on Moodle. It is highly recommended that you complete the calculations in Excel and input your answers below afterwards. Round all numbers to two decimal places except for days, which should be rounded to the nearest whole number. NOTE 2: You will be asked to upload your calculations in the next question. D B 2018 2017 1.06 E 2015 F 2014 1 2016 2 1.00 1.06 1.02 Current Ratio Quick Ratio 3 0.26 X 0.82 x 0.64 x 1.30 4 Total Asset Turnover 0.87 x X 5 6.65 X X x 6 55 X x x 7 x x 8 x x 9 Receivables Turnover Average Collection Period Inventory Turnover Days in Inventory Debt Ratio Debt-to-Equity Ratio Interest Coverage Ratio Gross Profit Margin Net Profit Margin x x x 10 2.60 X 140 X 0.28 X 0.05 X 11.18 X 20.33% X 7.25% x x 11 12 x 13 Based on the ratios that you have just calculated, prepare a written report between 300-500 words interpreting the ratios for Bombardier. Include at least one liquidity ratio, one activity ratio, one financial leverage ratio, and one profitability ratio (i.e. you do not need to analyze each ratio individually). The company expects you to interpre these ratios objectively, meaning you should choose both the positive and negative ones to analyze. You may make recommendations if desired. 2018 2017 2016 2015 2014 3,384 2.720 1.473 1.358 5,620 934 Assets Cash & cash equivalents Accounts receivable Contract Assets Inventories Other assets Total current assets Property. Plant and Equipment Aerospace program tooling Goodwill Deferred income taxes Investments in joint ventures and associates Other long-term assets Total long-term assets Total assets 3.187 1,575 2.617 4,402 567 12.348 1.557 4,519 1.948 746 2.211 1.629 12.610 24.958 2.988 1.174 2.460 3,429 4.992 15.043 1.696 3.581 2.042 595 1.220 1.631 4,286 763 11,284 1.949 5,174 1.855 2,489 1.538 1.588 6,382 1.122 13.119 2,092 6,823 2,127 875 12,105 2,061 3,975 1.978 761 356 1,667 10.798 698 332 294 491 1.468 9.873 24 916 1.503 11.511 22 795 2.284 14.495 27.614 22903 Liabilities Trade and other payables Provisions Contract liabilities Other current liabilities Total current liabilities Provisions Contract Liabilities Long-term debt Retirement Benefits Other liabilities Total liabilities 4.634 1.390 4,262 2,106 12.392 1.110 1,933 9.093 2.381 2.063 28.972 3.964 1.630 3.820 4.751 14.165 781 1.272 9,200 2,633 1.560 29 611 3.045 1,542 3,840 2,242 10.669 1.561 1,673 8.738 2.647 1,890 4.040 1.108 3.410 3,265 11.823 918 1.534 8,908 2.159 1.615 4,216 990 5,037 3,192 13.435 562 1.608 7.627 2.629 1.698 27.559 27 178 26.957 1549 1671 13 13 Shareholders' equity Common stock Retained earnings Total equity Total liabilities and equity 42 -5,563 -4.014 24.958 1913 -6.608 -4.695 24 916 -6,054 -4.383 22 795 -4.067 -4,054 22903 55 27 614 Bombardier Inc. Income Statement Year Ending December 31st, 2018 In millions of US$ 2017 2016 Revenue Cost of goods sold Gross Income 2018 16,236 13.958 2,278 16,199 14.204 1,995 16,339 14,622 1,717 2015 18,172 16.199 1,973 2014 20,111 17.534 2,577 Operating Expenses Selling, general & administrative Research and Development Total Operating expenses Operating income 1,213 355 1,156 217 1.373 905 1,194 240 1.434 561 1,133 287 1.420 297 1,358 347 1.705 872 1.568 405 606 745 348 Less: Interest expense, net Less: Other expense Plus: Other income 749 485 426 28 124 5,392 149 174 1,527 89 164 130 395 -807 -740 Net income before taxes Income tax expense Net income -446 79 77 174 -981 -5,186 154 -5,340 506 -1.246 318 -525
Step by Step Solution
There are 3 Steps involved in it
Step: 1

Get Instant Access to Expert-Tailored Solutions
See step-by-step solutions with expert insights and AI powered tools for academic success
Step: 2

Step: 3

Ace Your Homework with AI
Get the answers you need in no time with our AI-driven, step-by-step assistance
Get Started


