

Question
You have recently been hired as an Emergency Services Analyst for the city of Lincolnton, NC. In this role, you are to analyze all emergency
You have recently been hired as an Emergency Services Analyst for the city of Lincolnton, NC. In this role, you are to analyze all emergency services incident patterns, collect statistics, prepare and disseminate information, and assist with special projects. Recently, you have been tasked with conducting analysis on the emergency services data from 911 related calls from around the city.
Part 1: You receive the email from your Director of Emergency Services, including an Excel file of source data, and are asked to analyze the calls from around the community. You will perform your analysis (in the same Excel spreadsheet) and provide an explanation in an email response (Word document). Download the source data file below.
Emergency Call Source Data File
Within the spreadsheet, perform the following:
A.Make a dataset from the "Source Data" spreadsheet. Remove any potential errors or outliers, duplicate records, or data that are not necessary. Provide a clean copy of the data in your email response.
B. Explain why you removedeachcolumn and row from the "Source Data" spreadsheet or why you imputed data in empty fields as you prepared the data for analysis.
C.Make data sheets using your cleaned dataset and provideeach of the following to represent the requested aggregated data.
a. Table: date and number of events
b. Bar graph: date and number of events
c. Table: number of incident occurrences by event type
d. Bar graph: number of incident occurrences by event type
e. Table: sectors and number of events
f. Bar graph: sectors and number of events
D.Summarize your observations from reviewing the datasheets you have made and include it as part of your introduction to your analysis report analysis in Part 2.
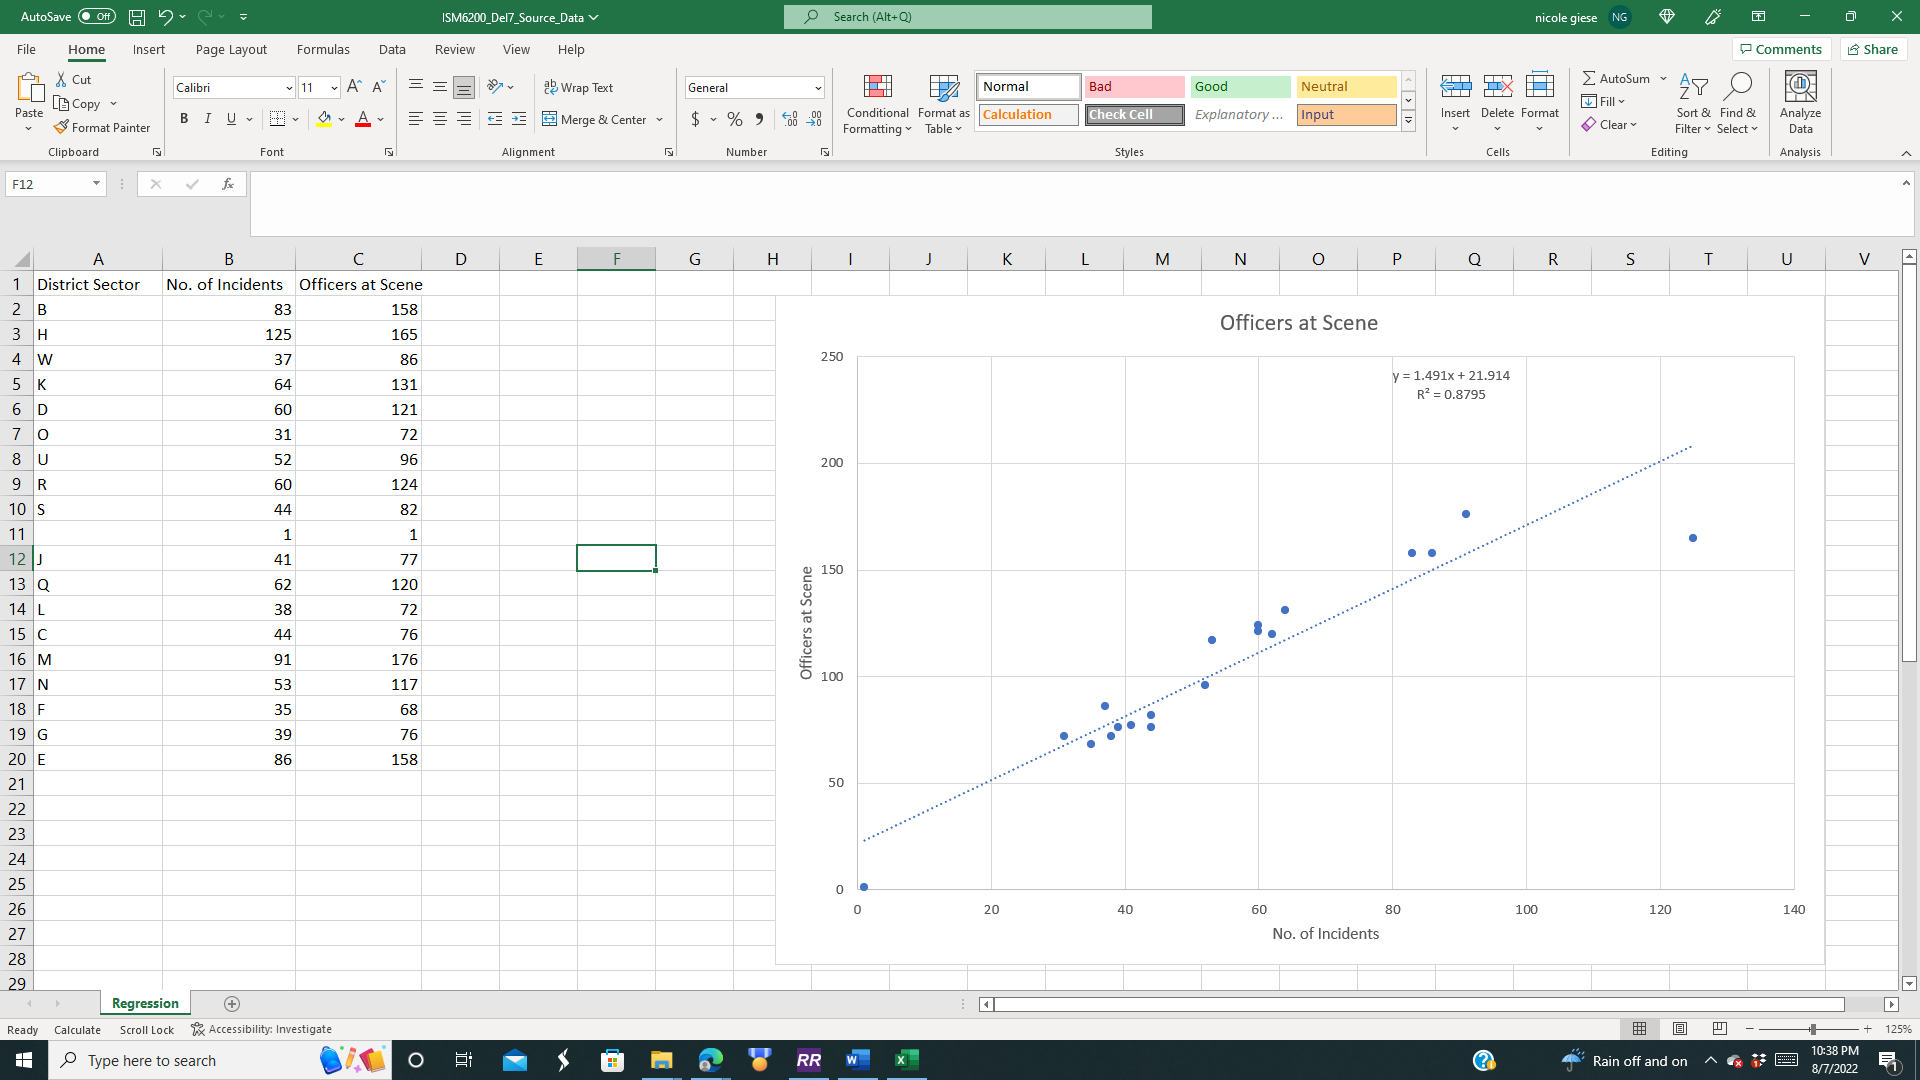
Part 2: Further, the state has offered an additional funding incentive for police departments that are able to meet the standard of having a minimum of 2.5 officers onsite per incident. The Director has delegated the task to you to analyze the police department's data to determine if the department will be eligible for additional funding. You will use the same source data provided in the Excel spreadsheet. In a Word document, complete the following questions and include the summary from Part 1 in an analysis report.
E.Describe the fit of the linear regression line to the data, providing graphical representations or tables as evidence to support your description.
F.Describe the impact of the outliers on the regression model, providing graphical representations or tables as evidence to support your description.
G. Make a residual plot and explain how to improve the linear regression model based on your interpretation of the plot.
H. Using the linear regression analysis, explain if the department qualifies for additional state funding, including any limitations posed by the available data to the assessment of the department's current funding eligibility.
I.Conduct a comparative matrix for the sectors. Explain how your findings impact the operations of the police department.
J.Describe the precautions or behaviors that should be exercised when working with and communicating about the sensitive data in this scenario.
K.Discuss any additional tools or technologies that could impact the data collection, storage, or analysis for future projects.
L. Provide attribution for credible sources needed in completing your report.
Step by Step Solution
There are 3 Steps involved in it
Step: 1

Get Instant Access to Expert-Tailored Solutions
See step-by-step solutions with expert insights and AI powered tools for academic success
Step: 2

Step: 3
Ace Your Homework with AI
Get the answers you need in no time with our AI-driven, step-by-step assistance
Get Started
Operations Management Creating Value Along the Supply Chain
Authors: Roberta S. Russell, Bernard W. Taylor
7th Edition
9781118139523, 0470525908, 1118139526, 978-0470525906