Answered step by step
Verified Expert Solution
Question
1 Approved Answer
You invested in two stocks. The table presents the returns of both stocks in the past 10 years. Answer Q1 to Q5. Year 10 9876
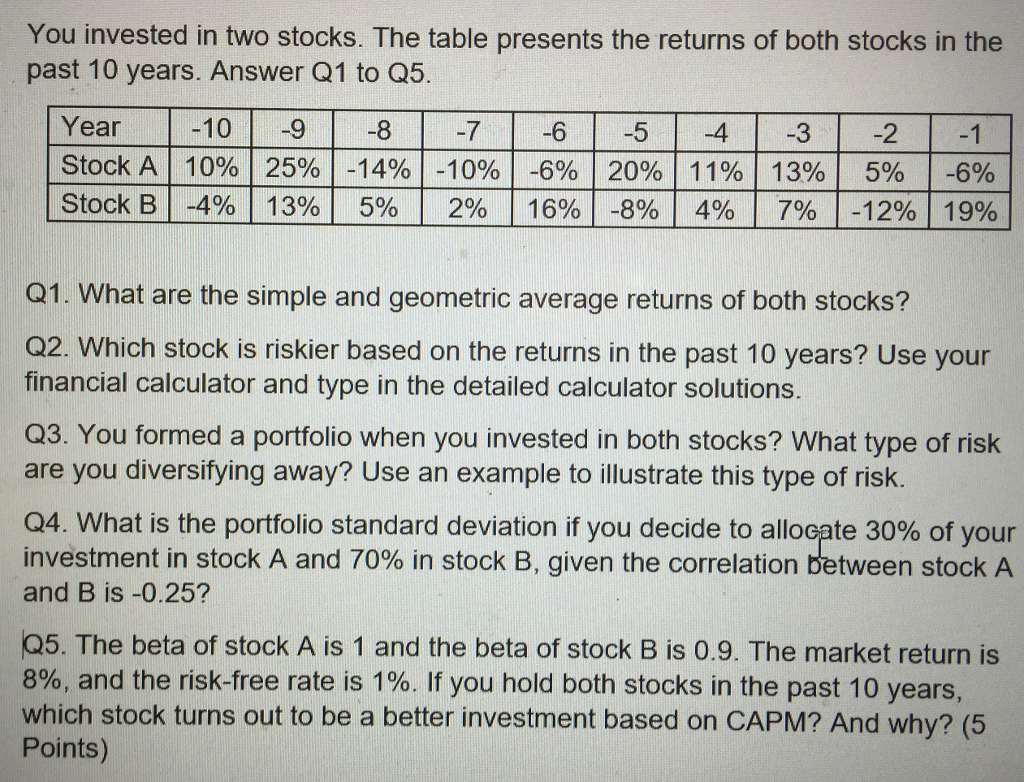
You invested in two stocks. The table presents the returns of both stocks in the past 10 years. Answer Q1 to Q5. Year 10 9876 53 21 Stock A1 10% 25%-14% -10% -6% 20% 11% 13% 5% -6% Stock B| -4% | 1390| 590 | 290 | 1690| -8% | 4% | 7% |-12% | 19% Q1. What are the simple and geometric average returns of both stocks? Q2. Which stock is riskier based on the returns in the past 10 years? Use your financial calculator and type in the detailed calculator solutions. Q3. You formed a portfolio when you invested in both stocks? What type of risk are you diversifying away? Use an example to illustrate this type of risk. Q4. What is the portfolio standard deviation if you decide to allocate 30% of your investment in stock A and 70% in stock B, given the correlation between stock A and B is -0.25? Q5. The beta of stock A is 1 and the beta of stock B is 0.9. The market return is 8%, and the risk-free rate is 1%. If you hold both stocks in the past 10 years, which stock turns out to be a better investment based on CAPM? And why? (5 Points)
Step by Step Solution
There are 3 Steps involved in it
Step: 1
Get Instant Access to Expert-Tailored Solutions
See step-by-step solutions with expert insights and AI powered tools for academic success
Step: 2
Step: 3
Ace Your Homework with AI
Get the answers you need in no time with our AI-driven, step-by-step assistance
Get Started