

Question
You may need to use the appropriate technology to answer this question. The Wall Street Journal's Shareholder Scoreboard tracks the performance of 1,000 major U.S.
You may need to use the appropriate technology to answer this question.
The Wall Street Journal's Shareholder Scoreboard tracks the performance of 1,000 major U.S. companies. The performance of each company is rated based on the annual total return, including stock price changes and the re investment of dividends. Ratings are assigned by dividing all 1,000 companies into five groups from A (top 20%), B (next 20%), to E (bottom 20%). Shown here are the one-year ratings for a sample of 60 of the largest companies.
| A | B | C | D | E |
|---|---|---|---|---|
| 5 | 8 | 14 | 20 | 13 |
Do the largest companies differ in performance from the performance of the 1,000 companies in the Shareholder Scoreboard? Use
= 0.05.
State the null and alternative hypotheses.
H0: The largest companies do not differ in performance from the 1,000 companies. Ha: The largest companies differ in performance from the 1,000 companies.H0: The largest companies differ in performance from the 1,000 companies. Ha: The largest companies do not differ in performance from the 1,000 companies. H0: The proportions of the largest companies compared to the 1,000 companies are the same for at least one of the five groups. Ha: The proportions of the largest companies compared to the 1,000 companies are different for all five groups.H0: The proportions of the largest companies compared to the 1,000 companies are the same for the majority of the five groups. Ha: The proportions of the largest companies compared to the 1,000 companies are different for the majority of the five groups.
Find the value of the test statistic. (Round your answer to three decimal places.)
Find the p-value. (Round your answer to four decimal places.)
p-value =
State your conclusion.
Reject H0. We conclude that the largest companies differ in performance from the 1,000 companies.Do not reject H0. We conclude that the proportions of the largest companies compared to the 1,000 companies are the same for the majority of the five groups. Do not reject H0. We conclude that the largest companies do not differ in performance from the 1,000 companies.Reject H0. We conclude that the proportions of the largest companies compared to the 1,000 companies are different for all five groups.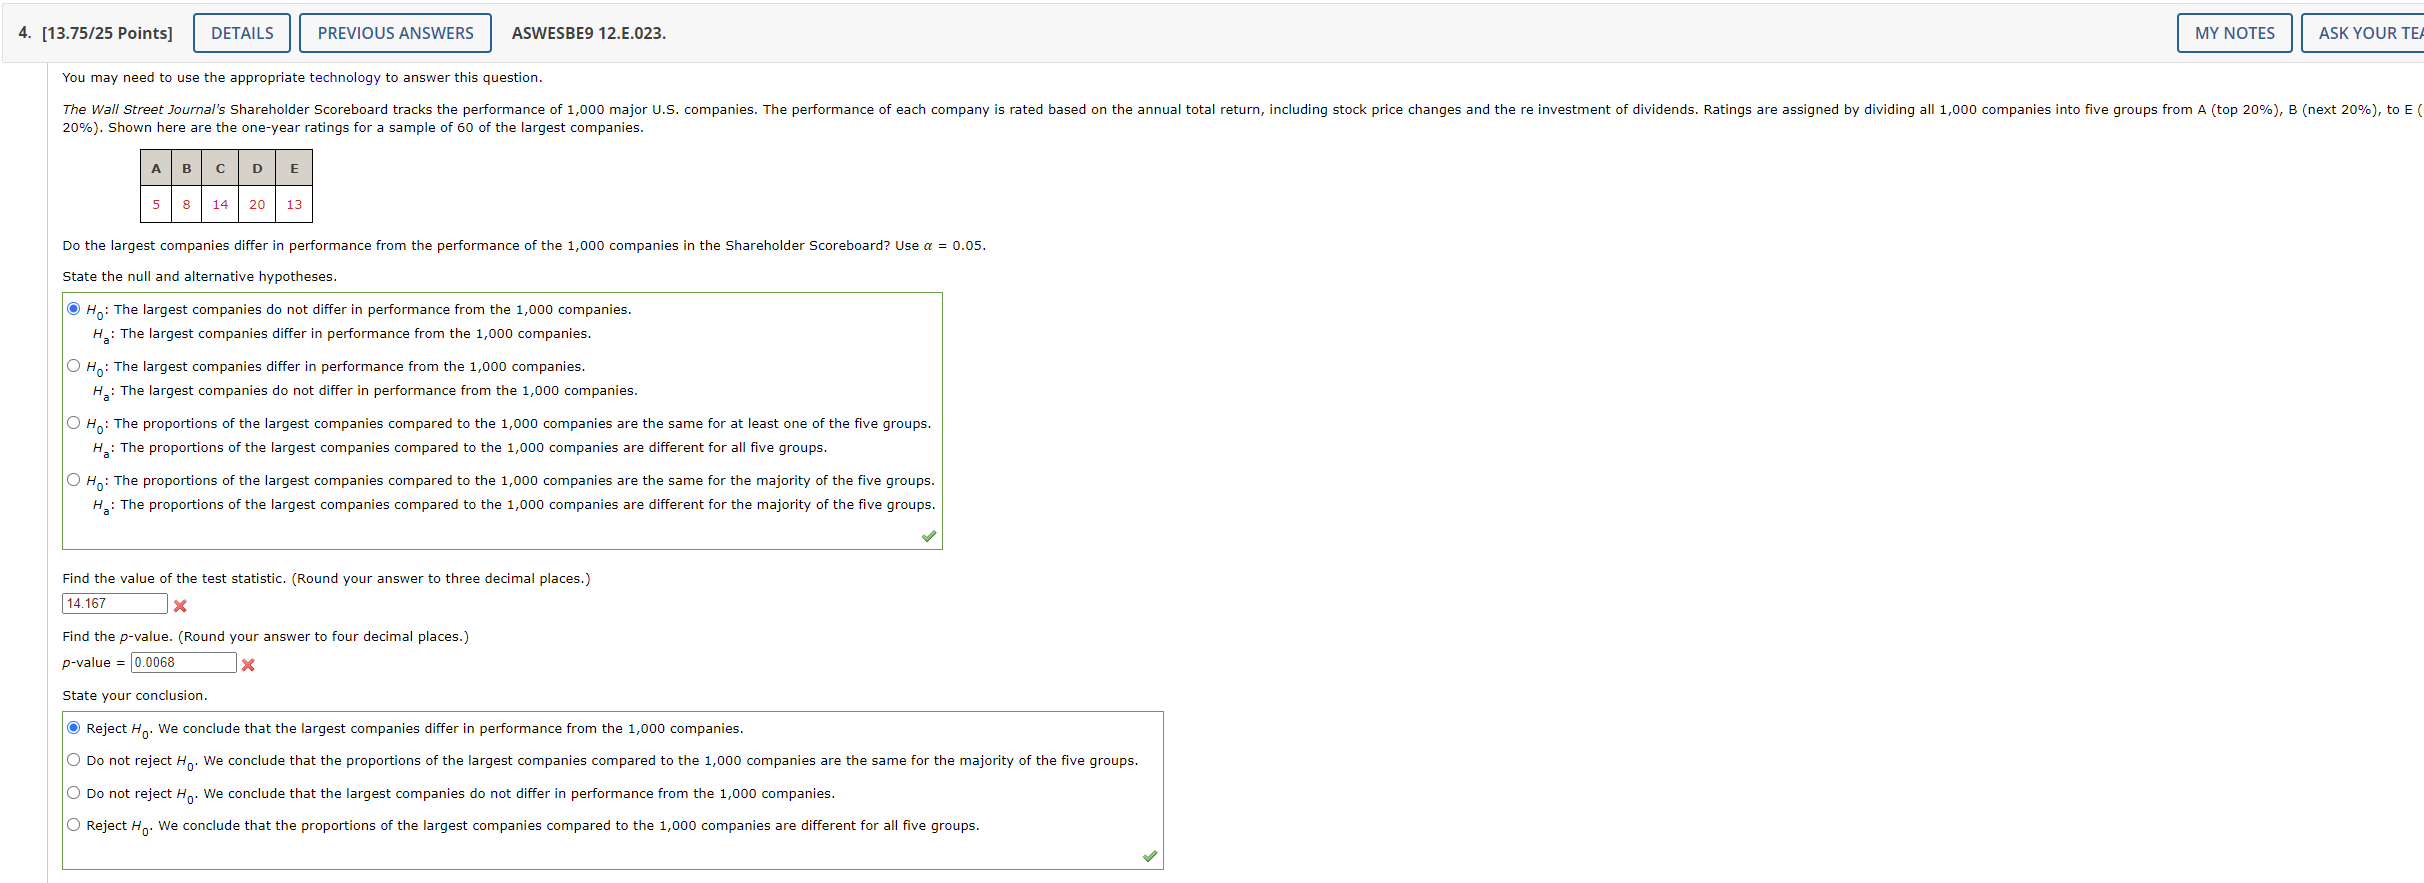
Step by Step Solution
There are 3 Steps involved in it
Step: 1

Get Instant Access to Expert-Tailored Solutions
See step-by-step solutions with expert insights and AI powered tools for academic success
Step: 2

Step: 3
Ace Your Homework with AI
Get the answers you need in no time with our AI-driven, step-by-step assistance
Get Started
Bill Payment Tracker A Financial Organizer For Efficient Expense Management
Authors: Tommy Ruell
1st Edition
B0CGWPF86P