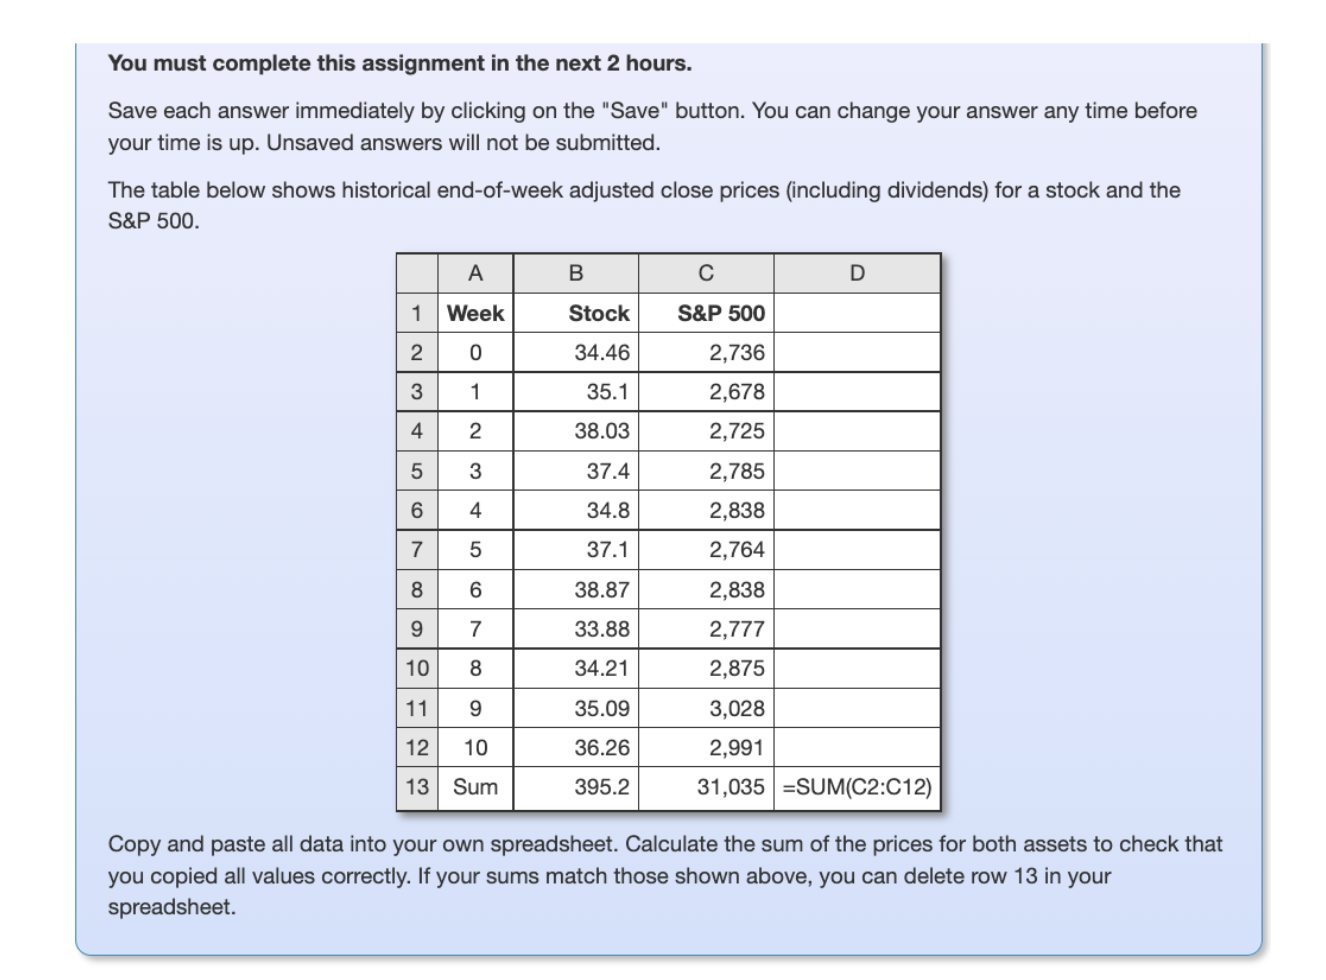
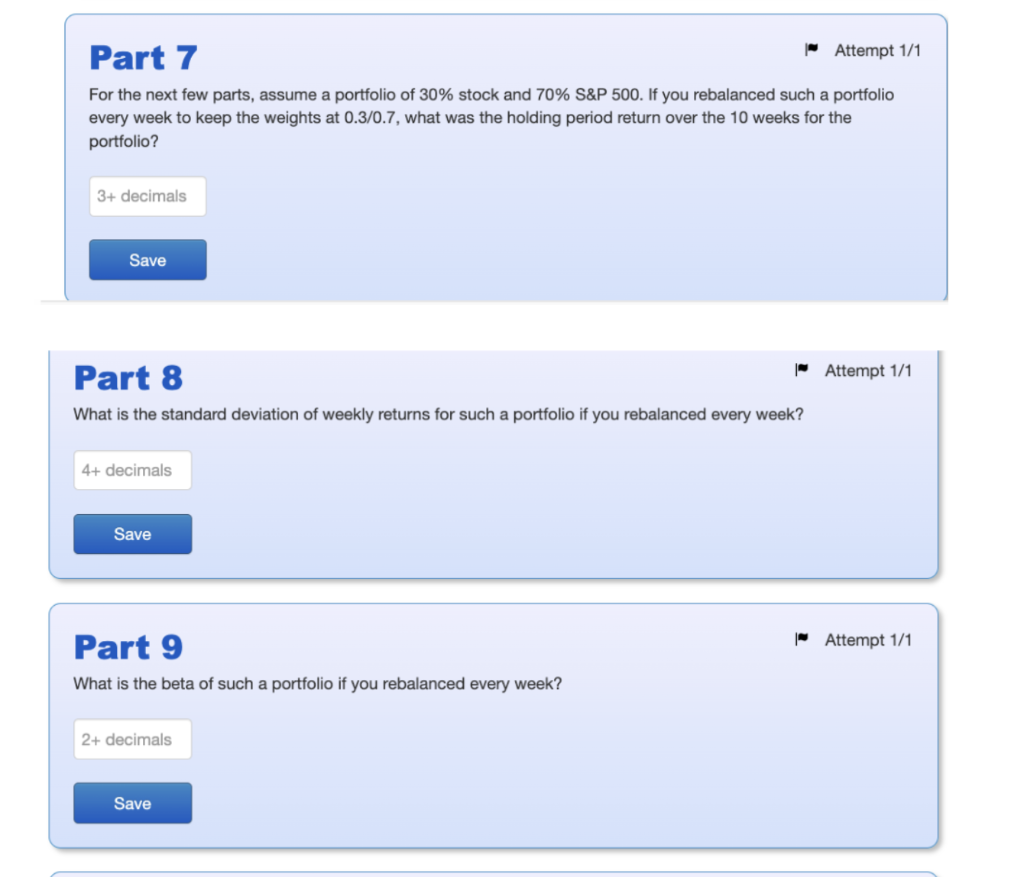
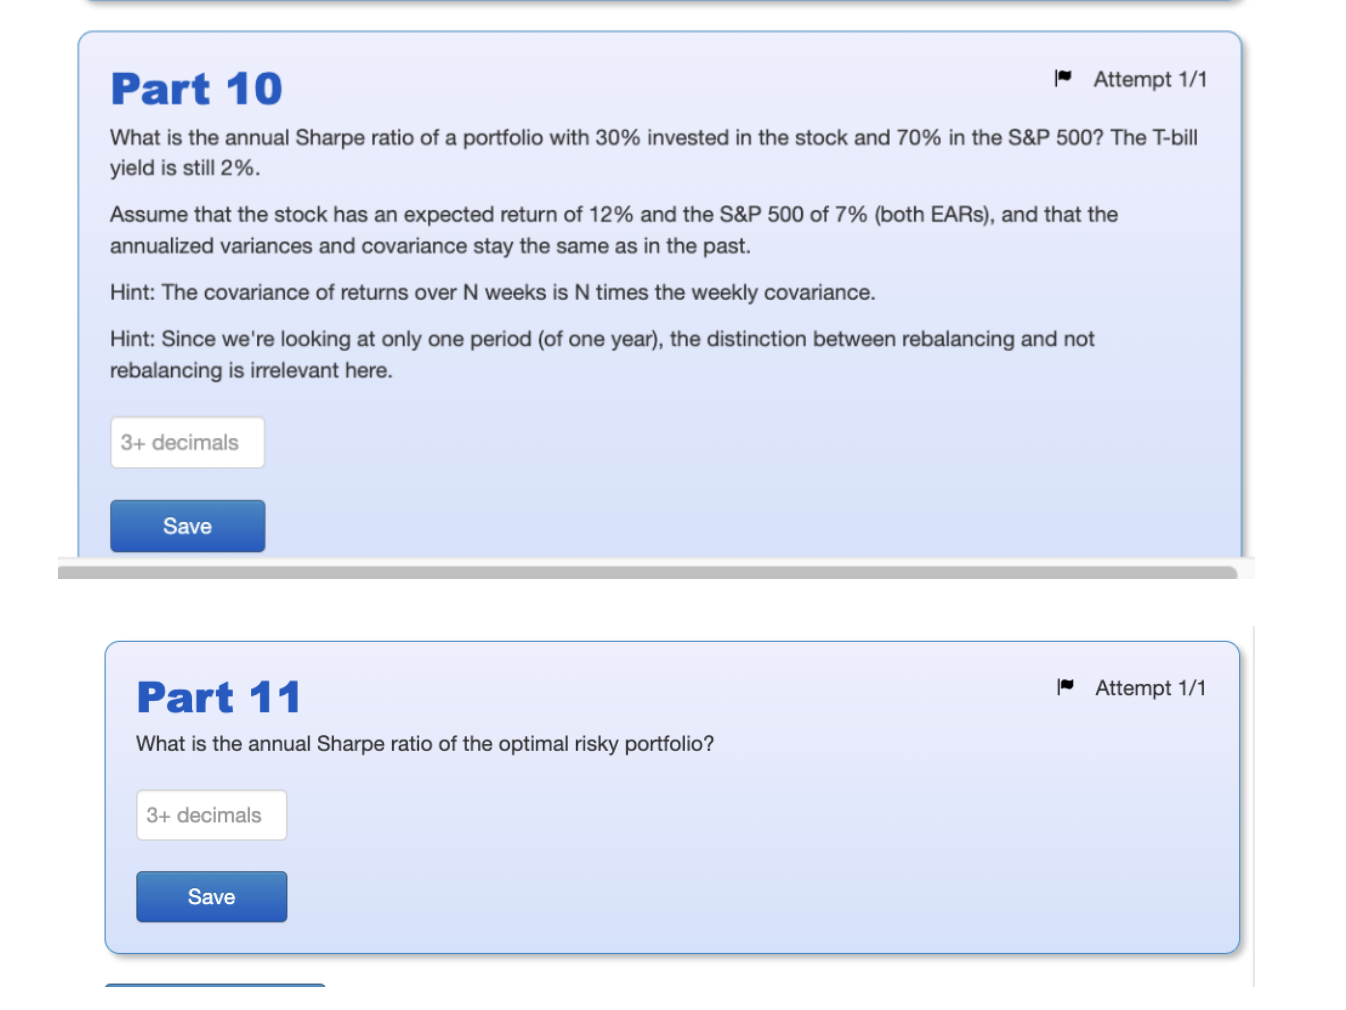
You must complete this assignment in the next 2 hours. Save each answer immediately by clicking on the "Save" button. You can change your answer any time before your time is up. Unsaved answers will not be submitted. The table below shows historical end-of-week adjusted close prices (including dividends) for a stock and the S&P 500. A B C D 1 Week Stock S&P 500 2 34.46 2,736 3 35.1 2,678 4 38.03 2,725 5 37.4 2,785 6 4 34.8 2,838 7 5 37.1 2,764 8 6 38.87 2,838 9 7 33.88 2,777 10 8 34.21 2,875 11 9 35.09 3,028 12 10 36.26 2,991 13 Sum 395.2 31,035 =SUM(C2:C12) Copy and paste all data into your own spreadsheet. Calculate the sum of the prices for both assets to check that you copied all values correctly. If your sums match those shown above, you can delete row 13 in your spreadsheet. OTN 0 1 2 3 | Part 7 Attempt 1/1 For the next few parts, assume a portfolio of 30% stock and 70% S&P 500. If you rebalanced such a portfolio every week to keep the weights at 0.3/0.7, what was the holding period return over the 10 weeks for the portfolio? 3+ decimals Save Part 8 Attempt 1/1 What is the standard deviation of weekly returns for such a portfolio if you rebalanced every week? 4+ decimals Save Part 9 Attempt 1/1 What is the beta of such a portfolio if you rebalanced every week? 2+ decimals Save Part 10 Attempt 1/1 What is the annual Sharpe ratio of a portfolio with 30% invested in the stock and 70% in the S&P 500? The T-bill yield is still 2%. Assume that the stock has an expected return of 12% and the S&P 500 of 7% (both EARs), and that the annualized variances and covariance stay the same as in the past. Hint: The covariance of returns over N weeks is N times the weekly covariance. Hint: Since we're looking at only one period (of one year), the distinction between rebalancing and not rebalancing is irrelevant here. 3+ decimals Save Part 11 What is the annual Sharpe ratio of the optimal risky portfolio? 3+ decimals Save Attempt 1/1 You must complete this assignment in the next 2 hours. Save each answer immediately by clicking on the "Save" button. You can change your answer any time before your time is up. Unsaved answers will not be submitted. The table below shows historical end-of-week adjusted close prices (including dividends) for a stock and the S&P 500. A B C D 1 Week Stock S&P 500 2 34.46 2,736 3 35.1 2,678 4 38.03 2,725 5 37.4 2,785 6 4 34.8 2,838 7 5 37.1 2,764 8 6 38.87 2,838 9 7 33.88 2,777 10 8 34.21 2,875 11 9 35.09 3,028 12 10 36.26 2,991 13 Sum 395.2 31,035 =SUM(C2:C12) Copy and paste all data into your own spreadsheet. Calculate the sum of the prices for both assets to check that you copied all values correctly. If your sums match those shown above, you can delete row 13 in your spreadsheet. OTN 0 1 2 3 | Part 7 Attempt 1/1 For the next few parts, assume a portfolio of 30% stock and 70% S&P 500. If you rebalanced such a portfolio every week to keep the weights at 0.3/0.7, what was the holding period return over the 10 weeks for the portfolio? 3+ decimals Save Part 8 Attempt 1/1 What is the standard deviation of weekly returns for such a portfolio if you rebalanced every week? 4+ decimals Save Part 9 Attempt 1/1 What is the beta of such a portfolio if you rebalanced every week? 2+ decimals Save Part 10 Attempt 1/1 What is the annual Sharpe ratio of a portfolio with 30% invested in the stock and 70% in the S&P 500? The T-bill yield is still 2%. Assume that the stock has an expected return of 12% and the S&P 500 of 7% (both EARs), and that the annualized variances and covariance stay the same as in the past. Hint: The covariance of returns over N weeks is N times the weekly covariance. Hint: Since we're looking at only one period (of one year), the distinction between rebalancing and not rebalancing is irrelevant here. 3+ decimals Save Part 11 What is the annual Sharpe ratio of the optimal risky portfolio? 3+ decimals Save Attempt 1/1