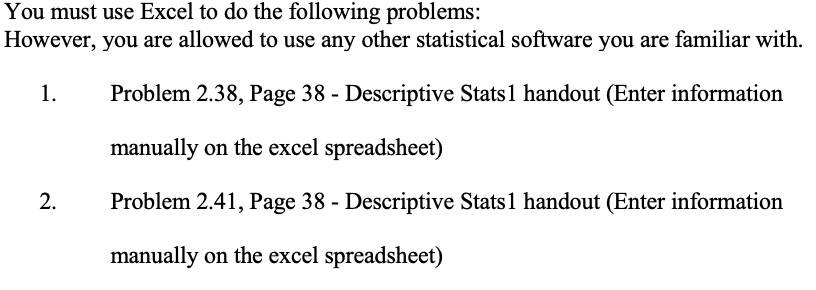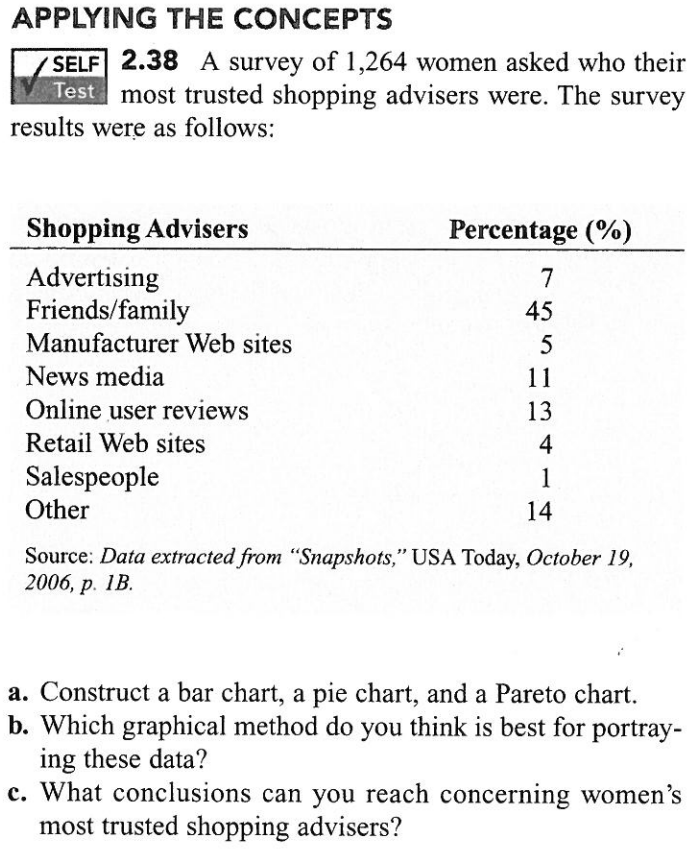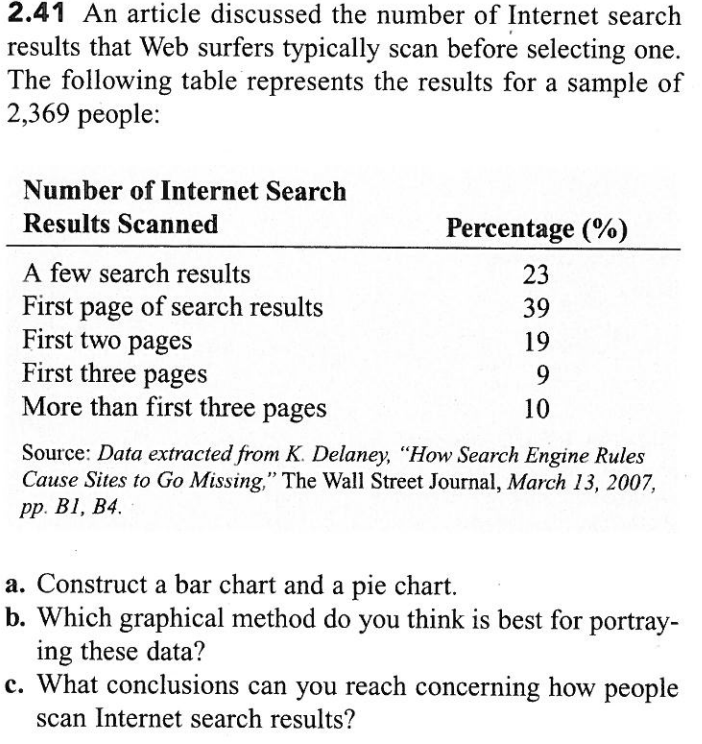


You must use Excel to do the following problems: However, you are allowed to use any other statistical software you are familiar with. 1. Problem 2.38, Page 38 - Descriptive Stats1 handout (Enter information manually on the excel spreadsheet) Problem 2.41, Page 38 - Descriptive Stats1 handout (Enter information manually on the excel spreadsheet) 2. APPLYING THE CONCEPTS SELF2.38 A survey of 1,264 women asked who their Test most trusted shopping advisers were. The survey results were as follows: Shopping Advisers Percentage (%) Advertising Friends/family Manufacturer Web sites News media Online user reviews Retail Web sites Salespeople Other 45 13 4 Source: Data extracted from "Snapshots," USA Today, October 19, 2006, p. IB. a. Construct a bar chart, a pie chart, and a Pareto chart. b. Which graphical method do you think is best for portray- ing these data? c. What conclusions can you reach concerning women's most trusted shopping advisers? 2.41 An article discussed the number of Internet search results that Web surfers typically scan before selecting one The following table represents the results for a sample of 2,369 people: Number of Internet Search Results Scanned Percentage (%) 23 39 19 A few search results First page of search results First two pages First three pages More than first three pages 10 Source: Data extracted from K. Delaney, "How Search Engine Rules Cause Sites to Go Missing," The Wall Street Journal, March 13, 2007, pp. BI, B4. a. Construct a bar chart and a pie chart. b. Which graphical method do you think is best for portray- ing these data? c. What conclusions can you reach concerning how people scan Internet search results? You must use Excel to do the following problems: However, you are allowed to use any other statistical software you are familiar with. 1. Problem 2.38, Page 38 - Descriptive Stats1 handout (Enter information manually on the excel spreadsheet) Problem 2.41, Page 38 - Descriptive Stats1 handout (Enter information manually on the excel spreadsheet) 2. APPLYING THE CONCEPTS SELF2.38 A survey of 1,264 women asked who their Test most trusted shopping advisers were. The survey results were as follows: Shopping Advisers Percentage (%) Advertising Friends/family Manufacturer Web sites News media Online user reviews Retail Web sites Salespeople Other 45 13 4 Source: Data extracted from "Snapshots," USA Today, October 19, 2006, p. IB. a. Construct a bar chart, a pie chart, and a Pareto chart. b. Which graphical method do you think is best for portray- ing these data? c. What conclusions can you reach concerning women's most trusted shopping advisers? 2.41 An article discussed the number of Internet search results that Web surfers typically scan before selecting one The following table represents the results for a sample of 2,369 people: Number of Internet Search Results Scanned Percentage (%) 23 39 19 A few search results First page of search results First two pages First three pages More than first three pages 10 Source: Data extracted from K. Delaney, "How Search Engine Rules Cause Sites to Go Missing," The Wall Street Journal, March 13, 2007, pp. BI, B4. a. Construct a bar chart and a pie chart. b. Which graphical method do you think is best for portray- ing these data? c. What conclusions can you reach concerning how people scan Internet search results


