Answered step by step
Verified Expert Solution
Link Copied!

Question

1 Approved Answer

You ran a regression of a stock's monthly excess return versus market index monthly excess returns and find the following: Coefficients Standard Error t-statistic p-value
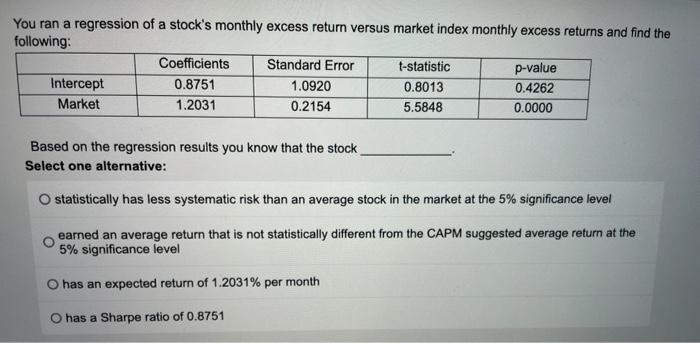
image text in transcribed
You ran a regression of a stock's monthly excess return versus market index monthly excess returns and find the following: Coefficients Standard Error t-statistic p-value Intercept 0.8751 1.0920 0.8013 0.4262 Market 1.2031 0.2154 5.5848 0.0000 Based on the regression results you know that the stock Select one alternative: O statistically has less systematic risk than an average stock in the market at the 5% significance level earned an average return that is not statistically different from the CAPM suggested average return at the 5% significance level has an expected return of 1.2031% per month has a Sharpe ratio of 0.8751

Step by Step Solution

There are 3 Steps involved in it

Step: 1

blur-text-image

Get Instant Access to Expert-Tailored Solutions

See step-by-step solutions with expert insights and AI powered tools for academic success

Step: 2

blur-text-image_2

Step: 3

blur-text-image_3

Ace Your Homework with AI

Get the answers you need in no time with our AI-driven, step-by-step assistance

Get Started

Recommended Textbook for

Personal Financial Planning For Executives And Entrepreneurs

Authors: Michael J. Nathanson, Jeffrey T. Craig, Jennifer A. Geoghegan, Nadine Gordon Lee, Michael A. Haber, Seth P. Hieken, Matthew C. Ilteris, D. Scott McDonald, Joseph A. Salvati, Stephen R. Stelljes

1st Edition

3030405273, 978-3030405274

More Books

Students also viewed these Finance questions