You work as a data scientist for a real estate company in a seaside resort town. Your boss has asked you to discover if it's
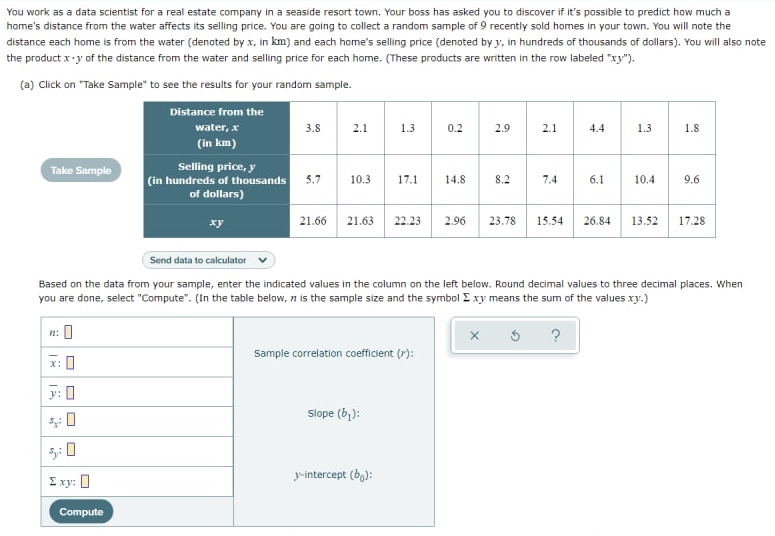
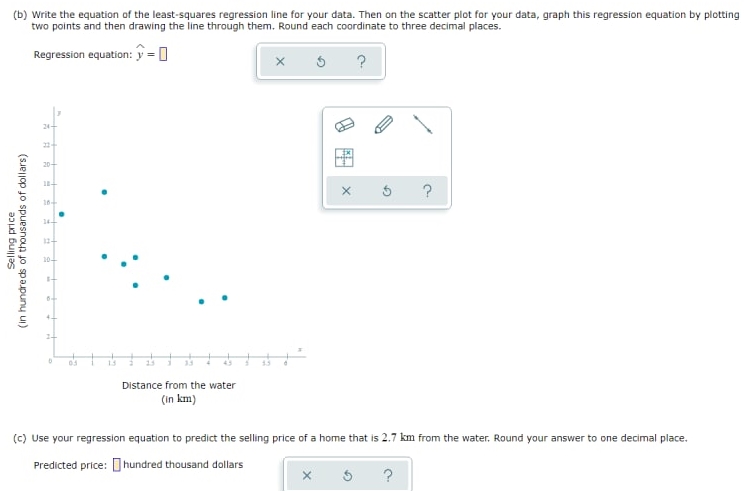
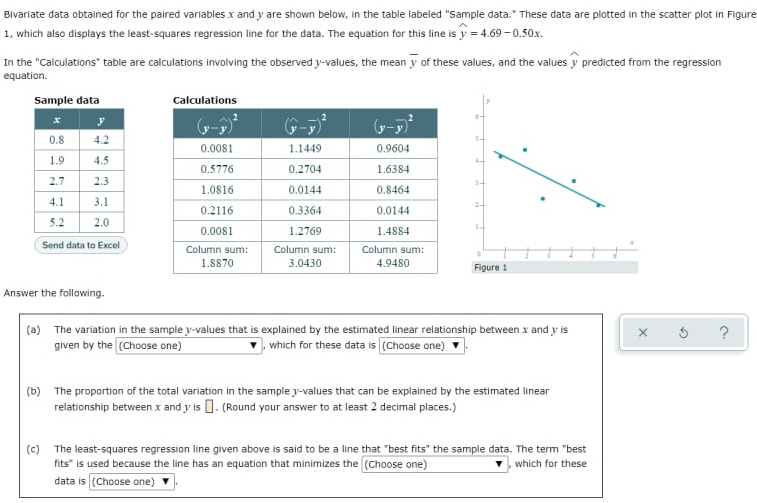
You work as a data scientist for a real estate company in a seaside resort town. Your boss has asked you to discover if it's possible to predict how much a home's distance from the water affects its selling price. You are going to collect a random sample of 9 recently sold homes in your town. You will note the distance each home is from the water (denoted by x, in km) and each home's selling price (denoted by y, in hundreds of thousands of dollars). You will also note the product xy of the distance from the water and selling price for each home. (These products are written in the row labeled "xy"). (a) Click on "Take Sample" to see the results for your random sample. Distance from the water, x 3.8 2.1 1.3 0.2 2.9 2.1 4.4 1.3 1.8 (in km) Take Sample Selling price, F (in hundreds of thousands 5.7 10.3 17.1 14.8 8.2 7.4 6,1 10.4 9.6 of dollars) xy 21.66 21.63 22.23 2.96 23.78 15.54 26.84 13.52 17.28 Send data to calculator Based on the data from your sample, enter the indicated values in the column on the left below. Round decimal values to three decimal places. When you are done, select "Compute". (In the table below, / is the sample size and the symbol _ xy means the sum of the values xy.) X ? x: 0 Sample correlation coefficient (r): Slope (b ): Exy: 0 y-intercept (by): Compute(b) Write the equation of the least-squares regression line for your data. Then on the scatter plot for your data, graph this regression equation by plotting two points and then drawing the line through them. Round each coordinate to three decimal places. Regression equation: y = 0 X ? 24- 20- X ? Selling price (in hundreds of thousands of dollars) Distance from the water (in km) (c) Use your regression equation to predict the selling price of a home that is 2.7 km from the water, Round your answer to one decimal place. Predicted price: hundred thousand dollars X ?Bivariate data obtained for the paired variables x and y are shown below, In the table labeled "Sample data." These data are plotted in the scatter plot in Figure 1, which also displays the least-squares regression line for the data. The equation for this line is y = 4.69 -0.50x. In the "Calculations" table are calculations involving the observed ]-values, the mean y of these values, and the values y predicted from the regression equation. Sample data Calculations y G-J) 0.8 4.2 0.0081 1.1449 0.9604 1.9 4.5 0.5776 0.2704 1.6384 2.7 2.3 1.0816 0.0144 0.8464 4.1 3,1 0.2116 0.3364 0.0144 5.2 2.0 0.0081 1.2769 1.4884 1. Send data to Excel Column sum: Column sum: Column sum: 1.8870 3.0430 4.9480 Figure 1 Answer the following. (a) The variation in the sample y-values that is explained by the estimated linear relationship between x and y is X ? given by the (Choose one) which for these data is (Choose one) (b) The proportion of the total variation in the sample y-values that can be explained by the estimated linear relationship between x and y is . (Round your answer to at least 2 decimal places.) (c) The least-squares regression line given above is said to be a line that "best fits" the sample data. The term "best fits" is used because the line has an equation that minimizes the (Choose one) . which for these data is (Choose one)
Step by Step Solution
There are 3 Steps involved in it
Step: 1
Get Instant Access to Expert-Tailored Solutions
See step-by-step solutions with expert insights and AI powered tools for academic success
Step: 2
Step: 3
Ace Your Homework with AI
Get the answers you need in no time with our AI-driven, step-by-step assistance