You work as an analyst for Jokull Rafnkelsson; the manager of a branch of a local bank in Reykjavik, Iceland. The bank specializes in lending to the fishing industry. Your job is to analyze the credit application of Helgason Veidi for a loan to buy a second fishing boat. Gunnar Helgason is the Chief Executive Officer of Helgason Veidi. Gunnar is a long-time friend of Jokull. Jokull needs your help in preparing a Credit Analysis for the Loan Committee where Helgason Veidis has applied for a loan to buy a second boat. You need to review all the materials given to you as part of this assignment so that you can prepare your analysis and recommendations for Jokull and the Loan committee. Jokull has asked you to address the following points:
1. Your recommendation as to whether the bank should extend a loan to Helgason Veidi as well as the terms for the loan.
2. Your assessment of the Helgason Veidi Loan application from the standpoint of the Five Cs of credit analysis. - In your evaluation of the CAPITAL, consider the Interest coverage ratio and the Debt to EBITDA ratio for the 2015-2018 time period. - In your evaluation of CASH FLOW, determine if the projected cash flows for 2018 provide sufficient cash flow to support the loan. (Note: In you calculations consider current projections with a 6% and a 7% interest rate. Also, reconsider the projections with a 10% decrease in revenues. As well as the overall CONDITION of the business.) - In your evaluation, consider the quality and availability of the COLLATERAL for the loan. - In your evaluation, consider the CHARACTER of the company and Mr. Helgason. Address any concerns about Mr. Helgasons relationship with Mr. Rafnkelsson that the Loan Committee should consider.
3. In your analysis also provide some insight to Jokull as to the possibility of Helgason Veidi rejecting the banks term loan proposal and opting to raise the debt through a bond offering.
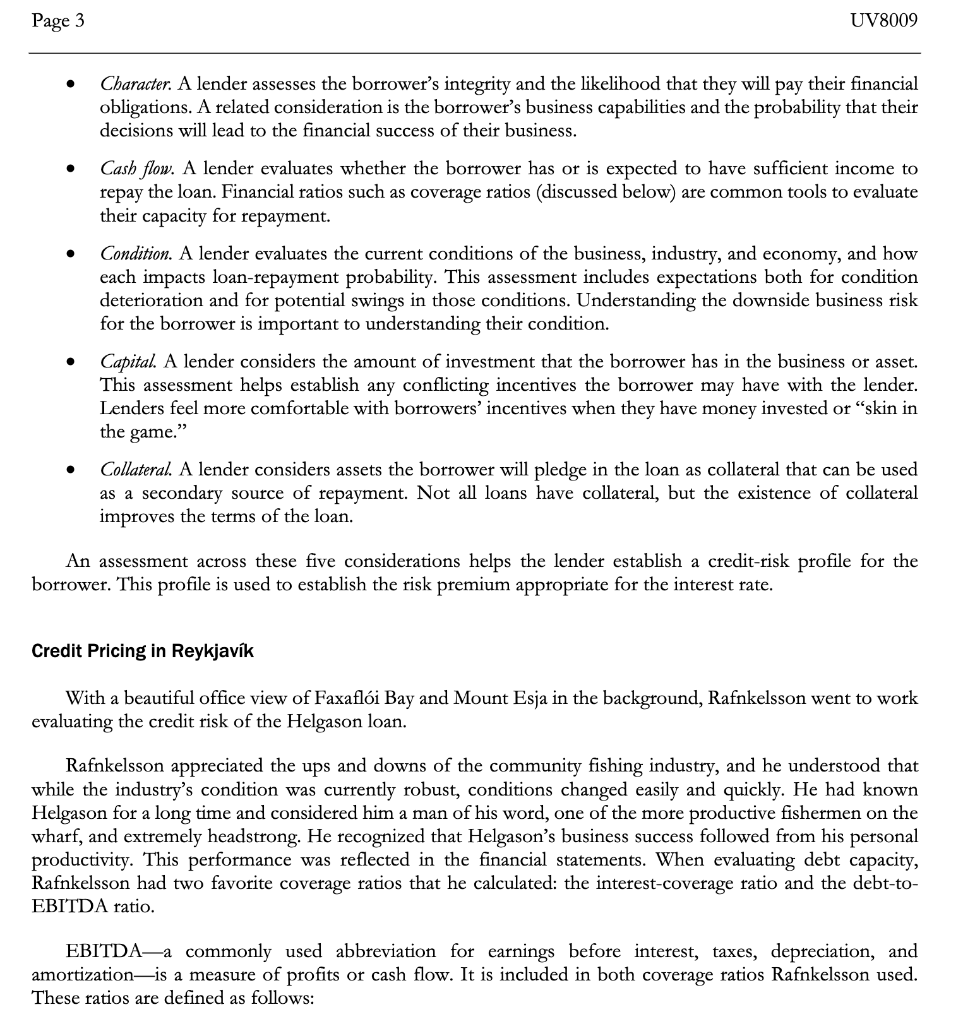
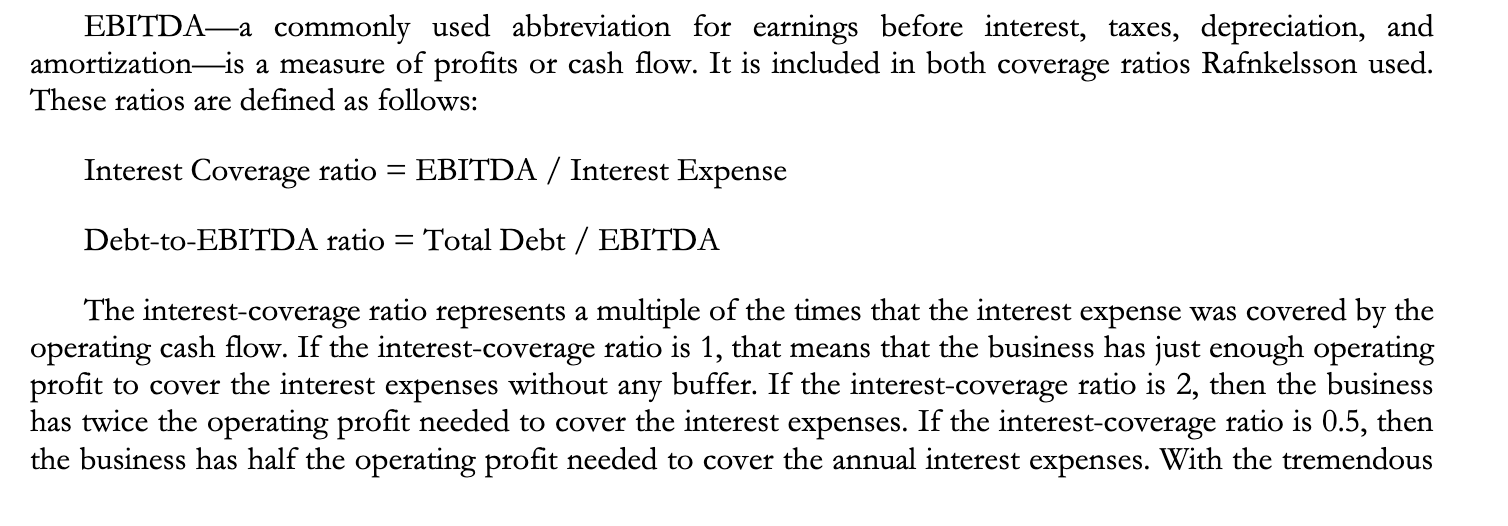
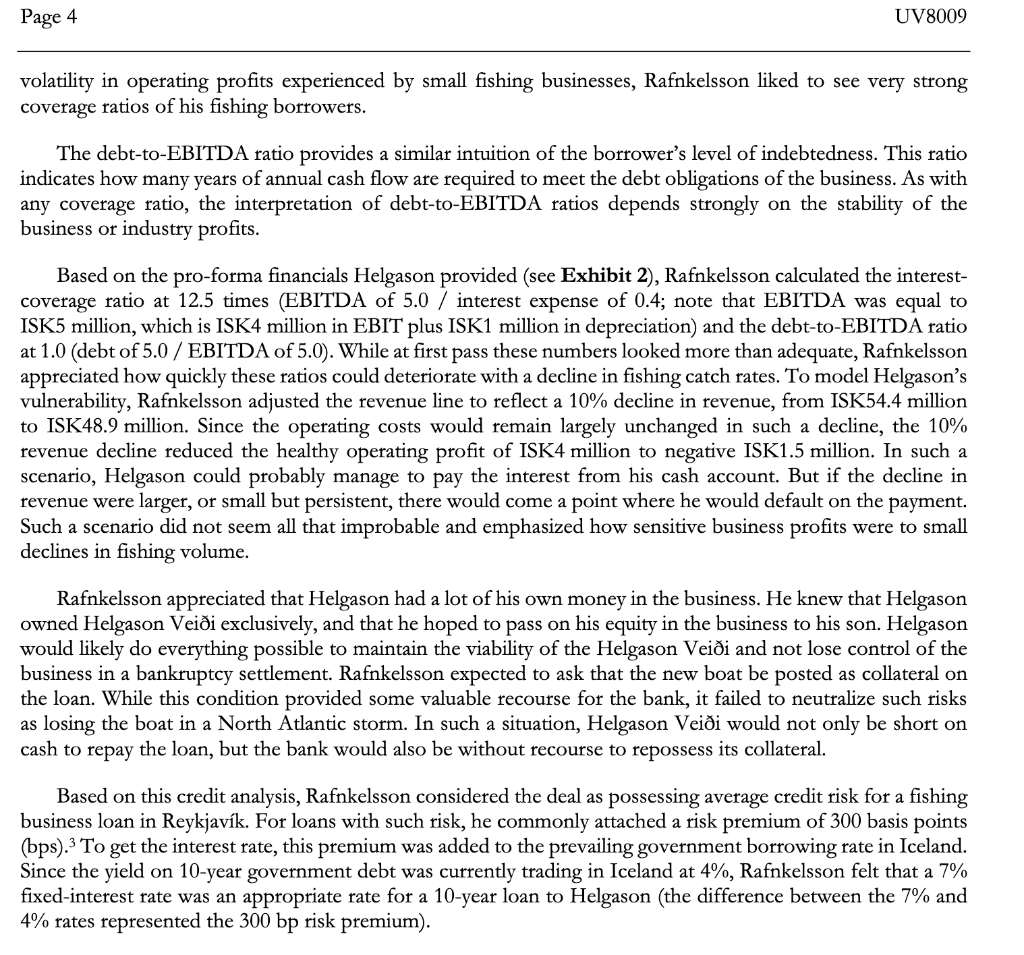
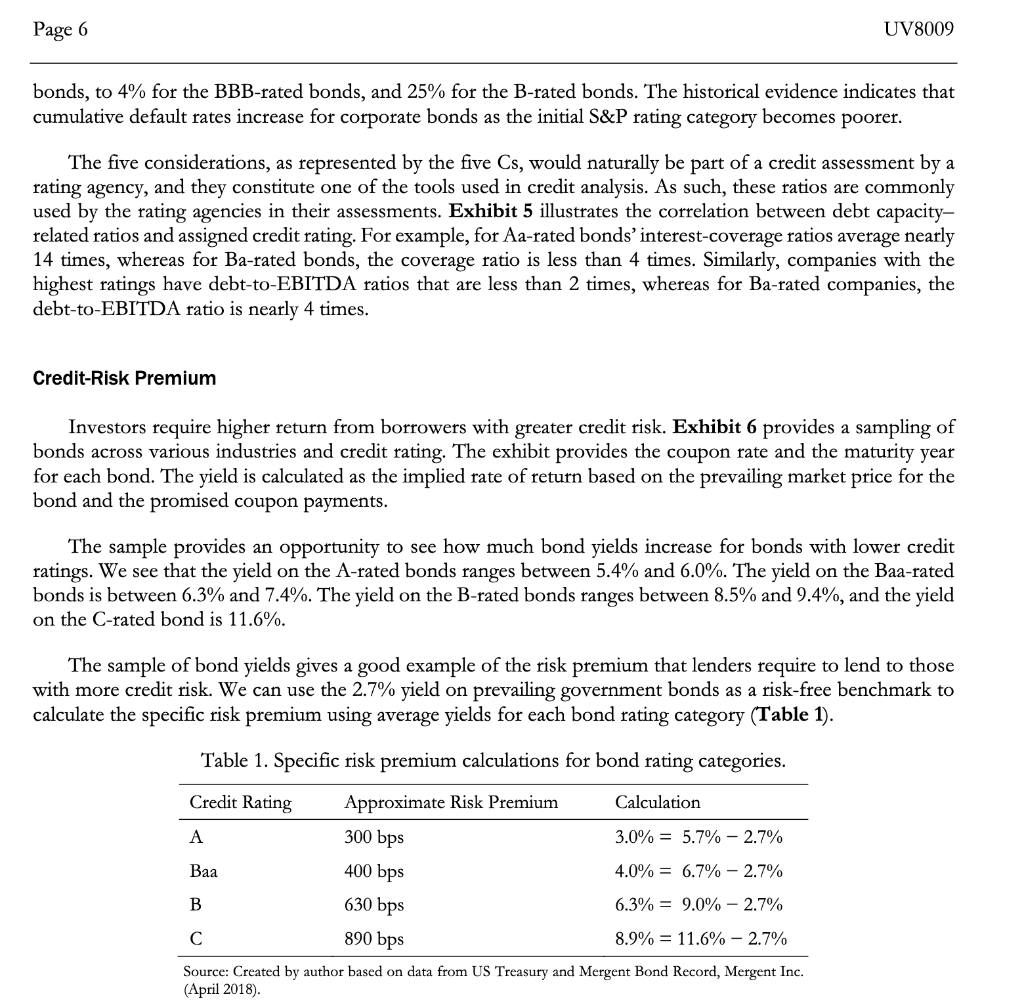
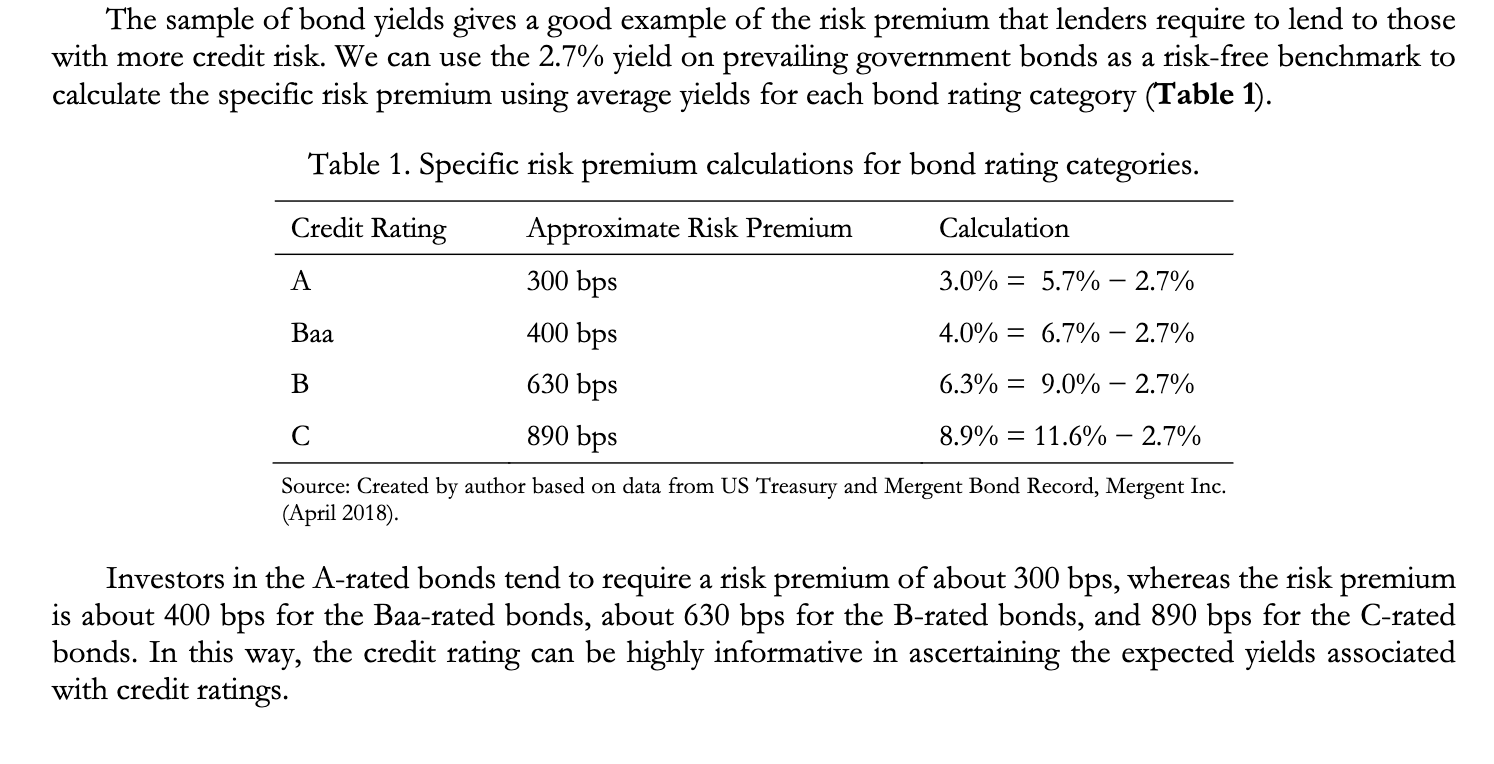
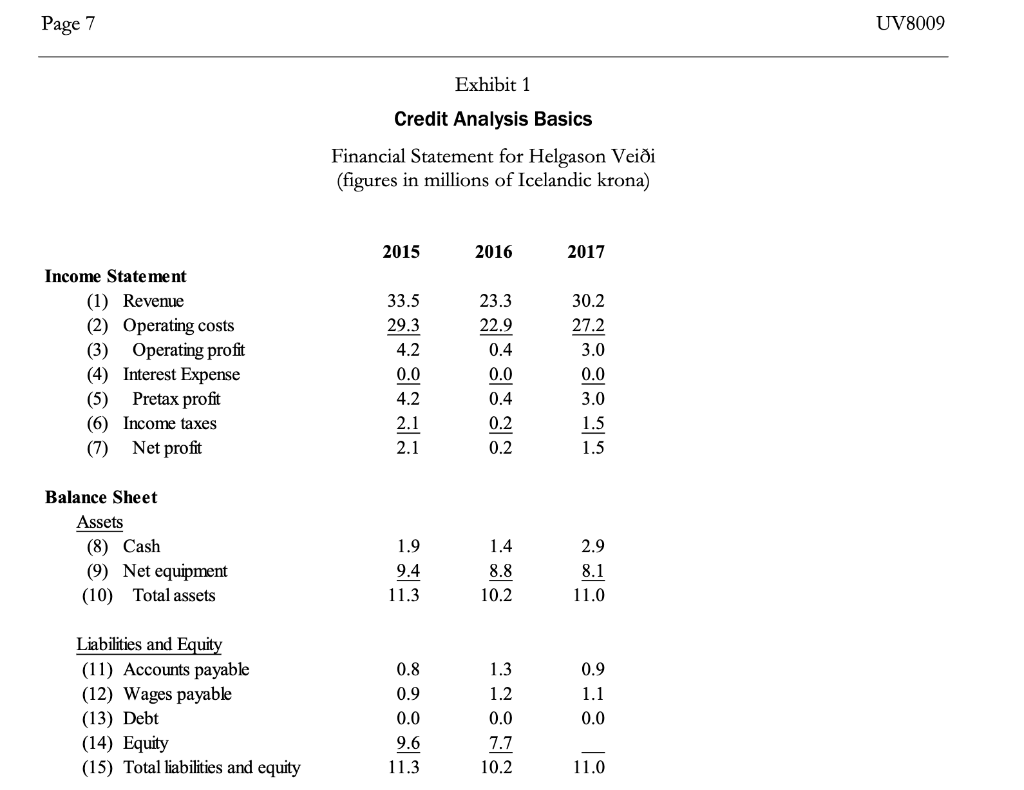
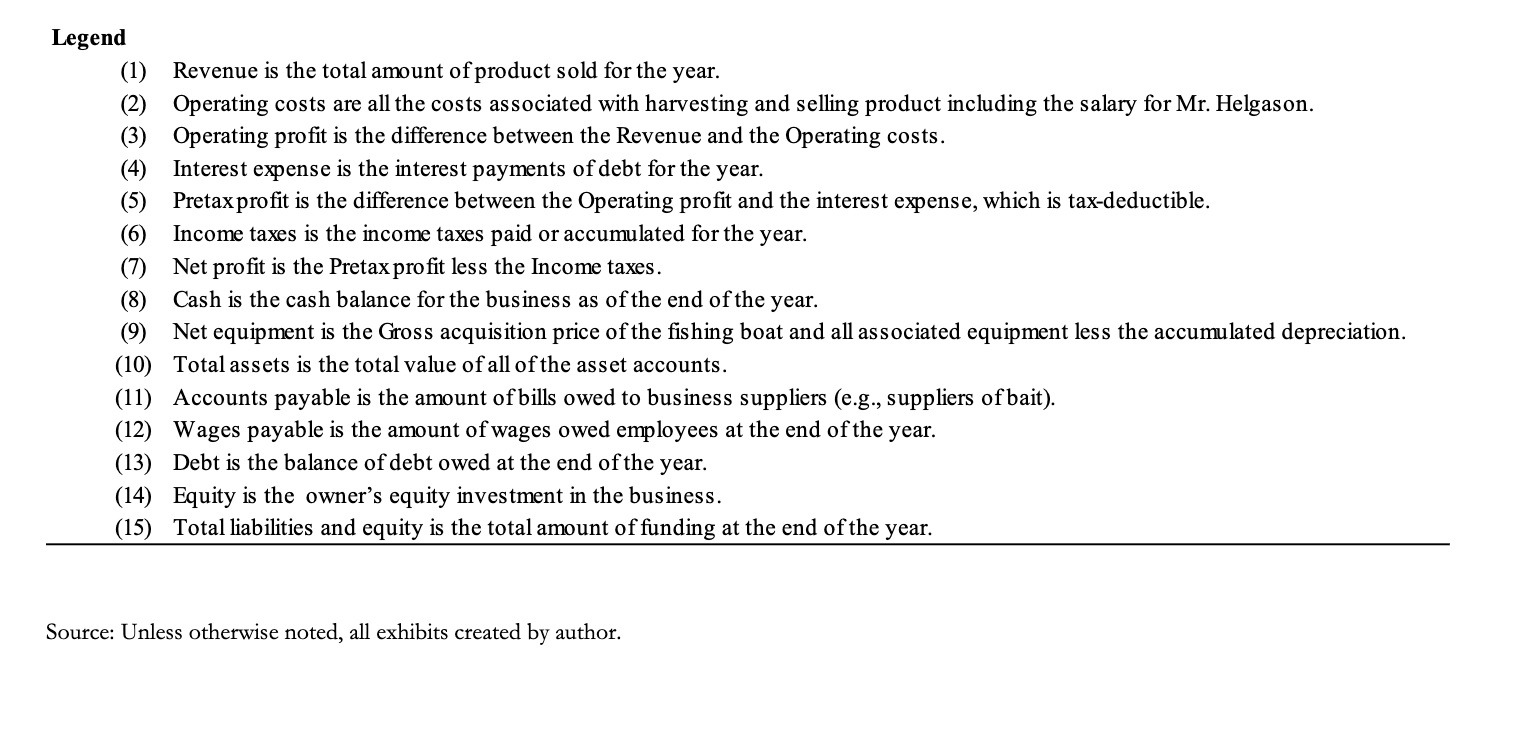
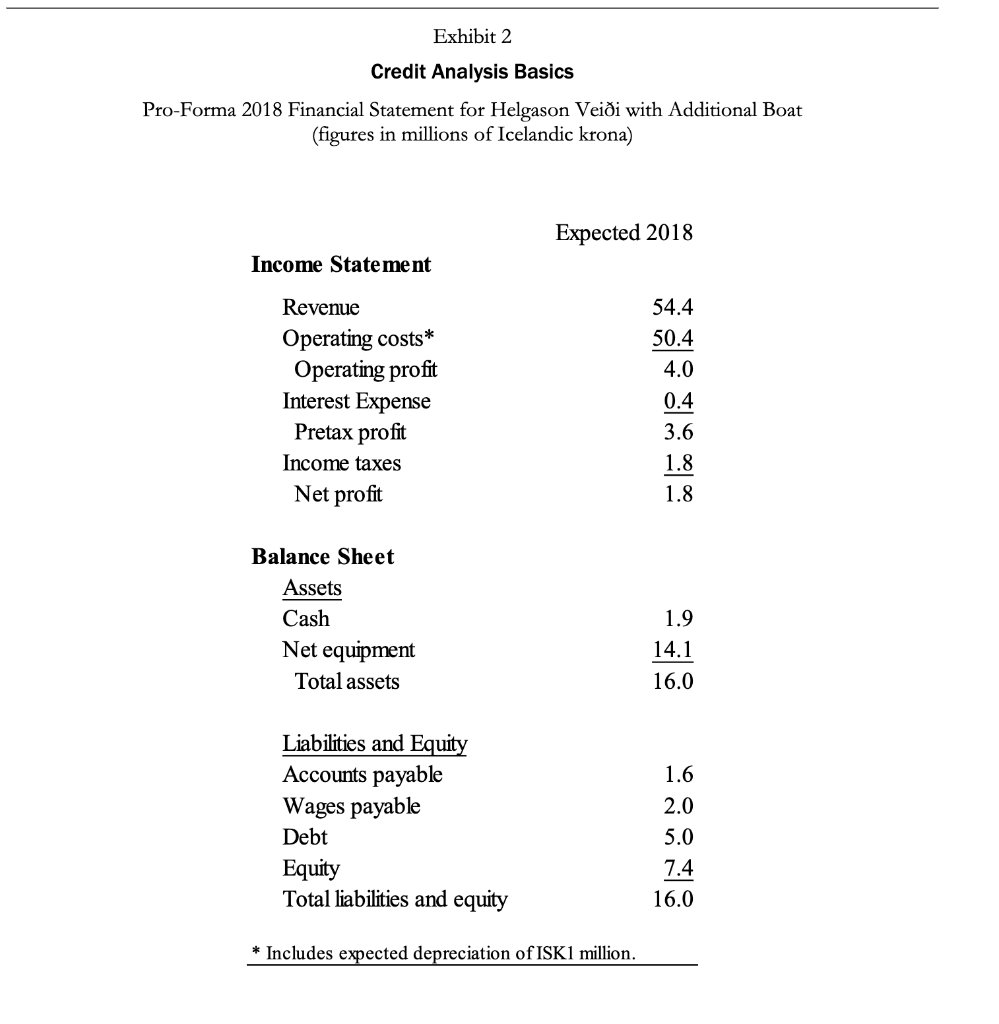
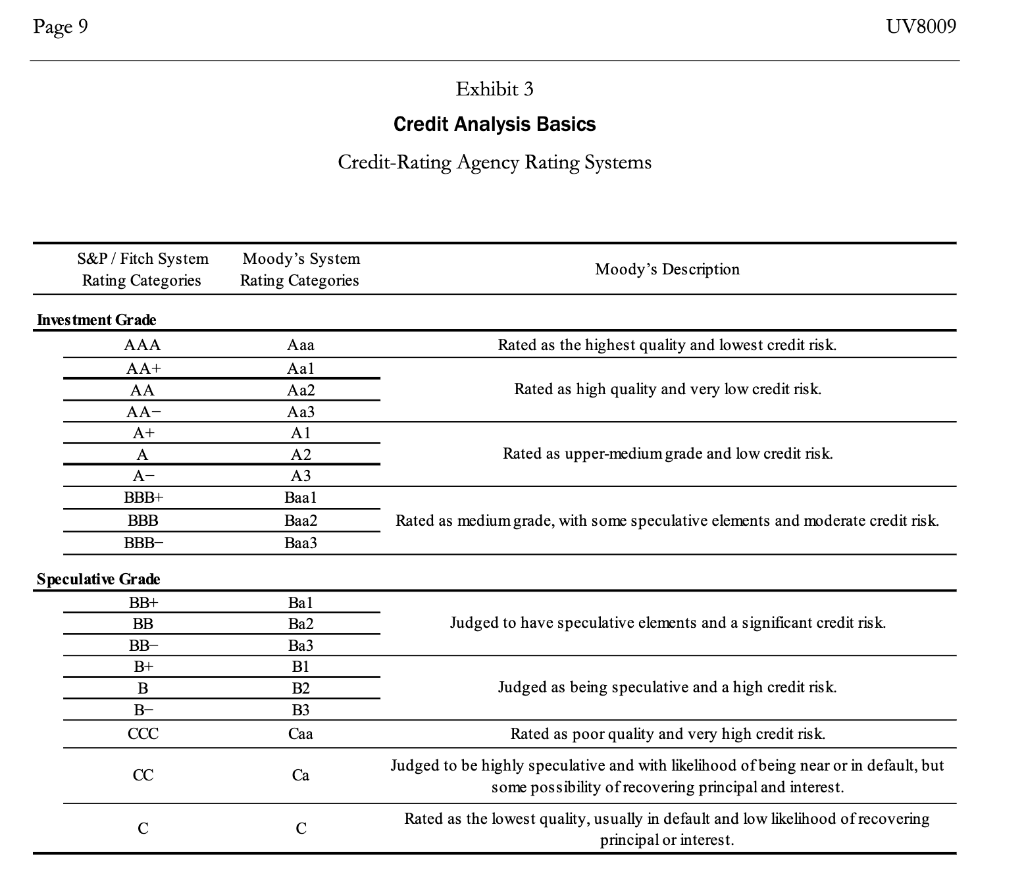
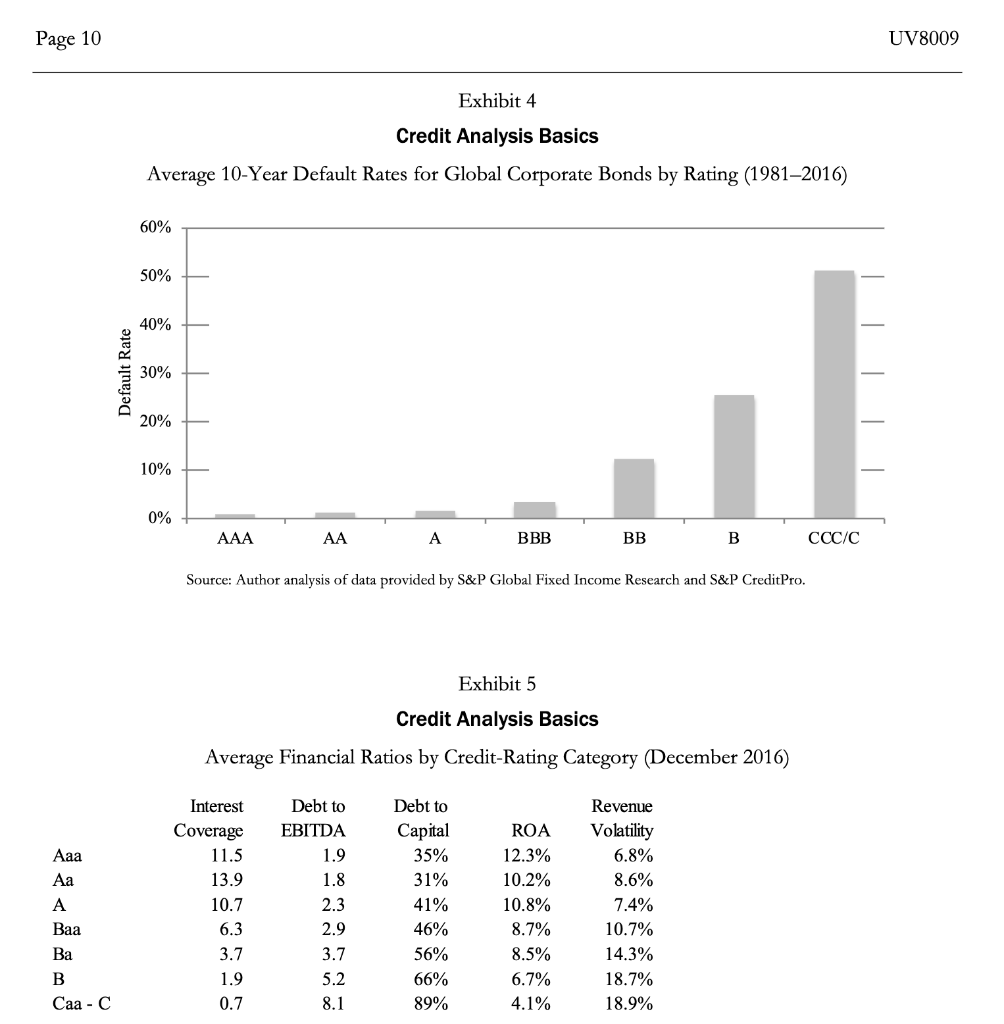
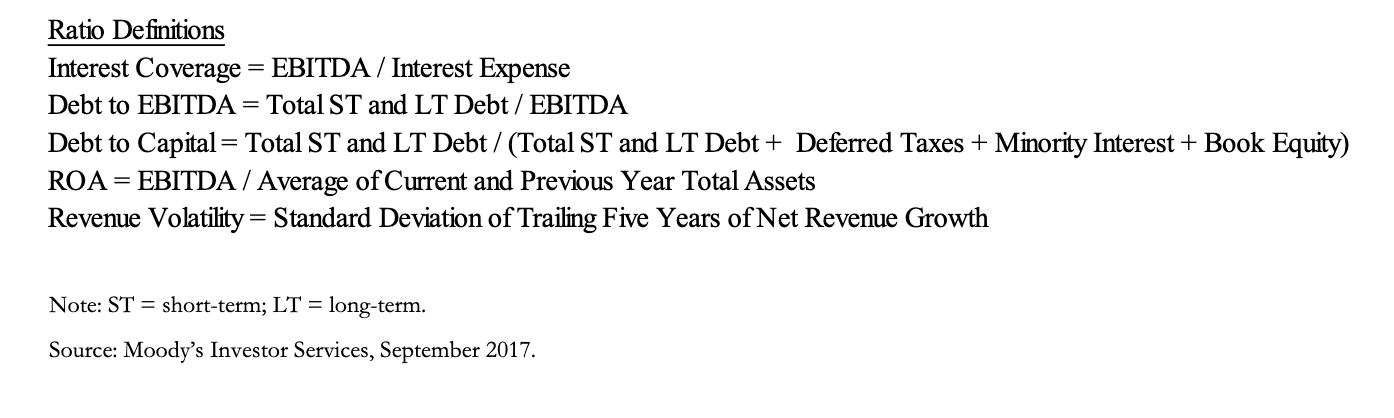
Credit Analysis Basics Capital markets facilitate the appropriate exchange of money. For lenders and borrowers, the interest rate is the primary pricing mechanism that markets use in this exchange. For borrowers deemed to have higher credit risk, lenders add a risk premium to the interest rate to compensate for higher risk. Credit risk is the risk that the borrower will default on (not pay) the payments agreed upon in the loan. Such risk-based interest rates ensure that money flows appropriately between lenders and borrowers. Credit analysis is the process of determining a potential borrower's credit risk. This note explores credit analysis and its relation to the credit-risk premium in interest rates. A Second Boat for Helgason Veii Iceland native Gunnar Helgason was a fisherman who worked out of Reykjavk. His fishing company, Helgason Veii, specialized harvesting North Atlantic cod and mackerel. The business had been highly successful, as detailed in its current financial statements (see Exhibit 1). The income statement captured the aggregate revenue and costs throughout the year; it indicated that Helgason Veiis revenue had varied from ISK34 million in 2015, to ISK23 million in 2016, then to ISK30 million in 2017.1 In 2017, the net profits of the business after deducting all expenses had been ISK1.5 million. While the income statement captured the volume of business activity over the year, the balance sheet provided a snapshot of the assets and liabilities of the business at the end of the year. At the end of 2017, the book value of Helgason's total assets was ISK11 million, most of which was his boat and fishing equipment. As he had little in terms of debt and other obligations, his equity position in the company totaled ISK9 million. Helgason wanted to grow the business by buying a second boat that his son would operate. The cost of acquiring a new fishing boat and the associated equipment was anticipated to run ISK6 million. Helgason expected that the second boat would increase company revenue by 80%. Using his financial modeling skills, Helgason created pro-forma financial statements for 2018 that reflected the expected impact of the additional boat. In the model he asserted that ISK5 million of the ISK6 million boat purchase expenditure would be funded with a new 10-year loan. Based on his analysis, Helgason believed that adding the boat made sense as long as the interest rate on the loan was not above 6%. Considering his strong business history, Helgason assumed that he could get the financing on good terms from his longtime friend, Jkull Rafnkelsson, who managed a branch of a local bank that specialized in lending to the fishing industry. Helgason emailed Rafnkelsson his request, invited him to lunch the next day at the Ljffengur Frysta, and attached his analysis along with some photos of some large catches he had recently made. Rafnkelsson accepted the lunch invitation and began to look over the numbers. Participants in financial markets generally come to a transaction with different sets of information. This asymmetry in information can have important implications for how markets function. One solution to this problem is the development of intermediaries that bridge the information asymmetry between market participants. As an example, suppose that 19-year-old Doris is considering purchasing her first car. Perusing the online used-car postings, she sees an older Toyota Corolla that appears to meet her needs perfectly and is being sold on a best-offer basis by a person named Lily. Doing some research, Doris considers that there are roughly three possible values for the car. First, the car might be in good condition and worth $8,000. Second, the car might be in average condition and worth $4,000. Lastly, the car might be a "lemon and worth nothing. She believes that each condition has equal probability. Her initial thought is to offer Lily $4,000 for the car. The $4,000 represents the expected value of the car based on the probabilities of the various conditions.2 On second thought, she realizes that Lily would accept an offer of $4,000 only if Lily believes that the car is worth no more than that. Recognizing this, Doris considers offering $2,000, equal to the conditional expected value of the average and lemon condition. But on reflection she realizes that Lily would accept the $2,000 offer only if the car is not worth more than $2,000. Realizing that with such differences in information she is bound to get a lemon, Doris considers giving up and just buying a bus pass. Because of the differences in information held by the buyer and seller, the buyer is never willing to offer the value of the car, and the market is destined to fail. Doris complains to her brother Justin, who recommends that she employ the services of an intermediary to provide an objective assessment of the car's condition, such as his friend, an auto mechanic. She follows Justin's recommendation. The mechanic takes a look at the car and declares it to be in good condition. Bolstered by the added information, Doris offers $8,000 for the Corolla and the seller accepts it. Doris has wheels and Lily has cashthe mechanic has saved the day by bridging the information gap. Banks play a similar role, acting as intermediaries between those with excess cash and those with insufficient cash. Those with insufficient cash would like to borrow money from those with excess cash. But because of asymmetric information, those with excess cash are unable to distinguish the creditworthy from the noncreditworthy borrowers. Lenders face an adverse selection concern, as they fear that only those with bad creditworthiness will borrow at average rates. Lenders need to assess the probability that a borrower defaults (fails to make the specified payments), but the cost of that assessment is too high. Instead, the bank saves the day: it aggregates money from those with excess cash and then uses its larger scale to cost-effectively assess the creditworthiness of borrowers. With the added information of these assessments, the bank can naturally adjust the price of a loan to reflect the probability of default and thereby allow for the appropriate credit risk. A lender faces two generic outcomes from a loan: (1) payment, in which the borrower pays the lender the stated interest payments and principal as agreed; or (2) default, in which the lender fails to make the payments and seeks to renegotiate the loan agreement, commonly through a bankruptcy court. In order for the lender to appropriately price a loan, they need an assessment of a borrower's credit risk (the likelihood that the borrower will fail to make the payments). The lender naturally requires more return (e.g., interest) on a loan from a borrower with high credit risk than from a borrower with low credit risk. The additional return required by the lender for bearing the credit risk is called the risk premium. In evaluating credit risk, a common credit-analysis framework is the "five Cs. These five principal considerations in credit-risk assessment are: Page 3 UV8009 . Character. A lender assesses the borrower's integrity and the likelihood that they will pay their financial obligations. A related consideration is the borrower's business capabilities and the probability that their decisions will lead to the financial success of their business. Cash flow. A lender evaluates whether the borrower has or is expected to have sufficient income to repay the loan. Financial ratios such as coverage ratios (discussed below) are common tools to evaluate their capacity for repayment. Condition. A lender evaluates the current conditions of the business, industry, and economy, and how each impacts loan-repayment probability. This assessment includes expectations both for condition deterioration and for potential swings in those conditions. Understanding the downside business risk for the borrower is important to understanding their condition. Capital. A lender considers the amount of investment that the borrower has in the business or asset. This assessment helps establish any conflicting incentives the borrower may have with the lender. Lenders feel more comfortable with borrowers' incentives when they have money invested or skin in the game. Collateral. A lender considers assets the borrower will pledge in the loan as collateral that can be used as a secondary source of repayment. Not all loans have collateral, but the existence of collateral improves the terms of the loan. . An assessment across these five considerations helps the lender establish a credit-risk profile for the borrower. This profile is used to establish the risk premium appropriate for the interest rate. Credit Pricing in Reykjavk With a beautiful office view of Faxafli Bay and Mount Esja in the background, Rafnkelsson went to work evaluating the credit risk of the Helgason loan. Rafnkelsson appreciated the ups and downs of the community fishing industry, and he understood that while the industry's condition was currently robust, conditions changed easily and quickly. He had known Helgason for a long time and considered him a man of his word, one of the more productive fishermen on the wharf, and extremely headstrong. He recognized that Helgason's business success followed from his personal productivity. This performance was reflected in the financial statements. When evaluating debt capacity, Rafnkelsson had two favorite coverage ratios that he calculated: the interest-coverage ratio and the debt-to- EBITDA ratio. EBITDAa commonly used abbreviation for earnings before interest, taxes, depreciation, and amortizationis a measure of profits or cash flow. It is included in both coverage ratios Rafnkelsson used. These ratios are defined as follows: EBITDAa commonly used abbreviation for earnings before interest, taxes, depreciation, and amortizationis a measure of profits or cash flow. It is included in both coverage ratios Rafnkelsson used. These ratios are defined as follows: Interest Coverage ratio EBITDA / Interest Expense Debt-to-EBITDA ratio = Total Debt / EBITDA The interest-coverage ratio represents a multiple of the times that the interest expense was covered by the operating cash flow. If the interest-coverage ratio is 1, that means that the business has just enough operating profit to cover the interest expenses without any buffer. If the interest-coverage ratio is 2, then the business has twice the operating profit needed to cover the interest expenses. If the interest-coverage ratio is 0.5, then the business has half the operating profit needed to cover the annual interest expenses. With the tremendous Page 4 UV8009 volatility in operating profits experienced by small fishing businesses, Rafnkelsson liked to see very strong coverage ratios of his fishing borrowers. The debt-to-EBITDA ratio provides a similar intuition of the borrower's level of indebtedness. This ratio indicates how many years of annual cash flow are required to meet the debt obligations of the business. As with any coverage ratio, the interpretation of debt-to-EBITDA ratios depends strongly on the stability of the business or industry profits. Based on the pro-forma financials Helgason provided (see Exhibit 2), Rafnkelsson calculated the interest- coverage ratio at 12.5 times (EBITDA of 5.0 / interest expense of 0.4; note that EBITDA was equal to ISK5 million, which is ISK4 million in EBIT plus ISK1 million in depreciation) and the debt-to-EBITDA ratio at 1.0 (debt of 5.0 / EBITDA of 5.0). While at first pass these numbers looked more than adequate, Rafnkelsson appreciated how quickly these ratios could deteriorate with a decline in fishing catch rates. To model Helgason's vulnerability, Rafnkelsson adjusted the revenue line to reflect a 10% decline in revenue, from ISK54.4 million to ISK48.9 million. Since the operating costs would remain largely unchanged in such a decline, the 10% revenue decline reduced the healthy operating profit of ISK4 million to negative ISK1.5 million. In such a scenario, Helgason could probably manage to pay the interest from his cash account. But if the decline in revenue were larger, or small but persistent, there would come a point where he would default on the payment. Such a scenario did not seem all that improbable and emphasized how sensitive business profits were to small declines in fishing volume. Rafnkelsson appreciated that Helgason had a lot of his own money in the business. He knew that Helgason owned Helgason Veii exclusively, and that he hoped to pass on his equity in the business to his son. Helgason would likely do everything possible to maintain the viability of the Helgason Veii and not lose control of the business in a bankruptcy settlement. Rafnkelsson expected to ask that the new boat be posted as collateral on the loan. While this condition provided some valuable recourse for the bank, it failed to neutralize such risks as losing the boat in a North Atlantic storm. In such a situation, Helgason Veii would not only be short on cash to repay the loan, but the bank would also be without recourse to repossess its collateral. Based on this credit analysis, Rafnkelsson considered the deal as possessing average credit risk for a fishing business loan in Reykjavk. For loans with such risk, he commonly attached a risk premium of 300 basis points (bps).3 To get the interest rate, this premium was added to the prevailing government borrowing rate in Iceland. Since the yield on 10-year vernment debt was currently trading in Iceland at 4%, Rafnkelsson felt that a 7% fixed-interest rate was an appropriate rate for a 10-year loan to Helgason (the difference between the 7% and 4% rates represented the 300 bp risk premium). Back at the Ljffengur Frysta The next day, Helgason and Rafnkelsson, along with Helgason's son Bjrn, met at the Ljffengur Frysta for lunch. Helgason and Rafnkelsson were both men of few words. After enjoying a traditional lamb soup for nearly an hour in complete silence, Helgason put down his spoon and asked Rafnkelsson the big question, "Hvaa hlutfall? Rafnkelsson looked up from his soup and announced his interest rate offer on the proposed loan with the resolute composure of a seasoned banker, 7%. 7%!, erupted Helgason. a er alger rn stafli af rottandi fiski rmum!, he thundered, which could roughly be translated as That's total robbery you stinking pile of rotten fish entrails! Helgason stormed out 3 A basis point (bp) is defined as one 100th of a percentage point. Page 5 UV8009 of the restaurant, face red with rage and scorn. Bjrn and Rafnkelsson looked back at their soup and finished the meal, then Rafnkelsson gave Bjrn a ride home. Corporate Bonds An alternative to the bank loan market, the corporate bond market is an important source of credit for businesses of sufficient scale. In the bond market, companies divide their total borrowing need into smaller, tradable financial securities (e.g., $1,000). Companies sell these bond securities to investors through an intermediary called an investment bank that connects the borrower to a large number of investors interested in buying the bonds. The investment bank advises the company on the terms of the bond, including the interest rate (also known in bond vocabulary as the coupon rate). a Just as Rafnkelsson did a credit-risk assessment of Helgason's loan, corporate bond investors also require credit-risk analysis. However, with millions of different corporate bonds trading in financial markets, corporate- bond risk assessment is a daunting challenge. To facilitate efficient processing of corporate-bond credit-risk assessments, credit-rating agencies emerged in the early 1900s to centralize this process. Since then, agencies such as Moody's, Fitch, and Standard & Poor's have been active in providing default-risk assessments for a large number of corporate bonds. The credibility of credit-risk analysis by credit-rating agencies depends wholly on their incentives to maintain strong reputations. The credit-rating agencies stay in business only if people believe they are proficient at credit analysis. Credit-rating agencies generate their revenue primarily through the fees they charge companies to rate the companies' bonds. Companies are willing to pay the rating fees because having a rating (even a bad rating) tends to lower their cost of borrowing. This may be because investors are wary of unrated bonds, as suggested by the example of Doris's worry about making a nave offer on a used car. In theory, rating fees are kept in check by the competitive forces between the three primary rating agencies. Quality is maintained by the critical nature of reputational capital in this industry.4 The credit assessment provided by these agencies has been standardized into what is called a credit rating. The credit rating is a standardized assessment of the credit risk associated with a borrower or a particular bond. The rating agencies follow letter-based formats for denoting their ratings (Exhibit 3 provides details on the full range of rating categories). For S&P and Fitch ratings, low-risk bonds (called investment grade bonds) are denoted by the ratings AAA, AA, A, or BBB. Among investment-grade bonds, AAA-denoted bonds are considered to have the lowest risk of default, and BBB-rated bonds are considered to have the highest risk of default. High-risk bonds (called speculative grade or junk bonds) are denoted by the ratings BB, B, CCC, CC, and C. Among speculative-grade bonds, BB-denoted bonds are considered to have the lowest credit risk among the speculative-grade bonds, and C-rated bonds are considered to have the highest credit risk. Moody's follows a mostly similar rating system, where, for example, the rating Baa is equivalent to the rating BBB in the S&P/Fitch system. To provide more detail on their ratings, the rating agencies refine their broad ratings with "notching." Notching adds additional grades to the broad letter grades. In the S&P/ Fitch system, a _ is added to the letter grade. A+ is a little safer rating and A is a little riskier rating than A. For Moody's, a 1, 2, or 3 is added, with 1 being the better rating and 3 the poorer rating. For example, a BBB-or Baa3 rating is the lowest investment-grade bond rating under the S&P/Fitch system and Moody's system, respectively. a + or a Like any expert service, the various rating agencies compete on their ability to provide expert knowledge at efficient costs. Investors tend to trust the agency that appears to be best at correctly predicting default rates. Exhibit 4 provides some evidence of the average rates of default over the various categories of S&P ratings. The exhibit shows that the default rate over a 10-year horizon climbs from effectively zero for the high-grade 4 Following the 20078 financial crisis, the rating agencies came under heavy scrutiny for what was widely perceived as a failure in the quality of the credit ratings assigned to securitized housing mortgages. These allegations led to several lawsuits and settlements by the rating agencies for their ratings during this time. Such legal and reputational penalties create a strong long-term incentive for rating agencies to maintain fair and accurate ratings. Page 6 UV8009 bonds, to 4% for the BBB-rated bonds, and 25% for the B-rated bonds. The historical evidence indicates that cumulative default rates increase for corporate bonds as the initial S&P rating category becomes poorer. The five considerations, as represented by the five Cs, would naturally be part of a credit assessment by a rating agency, and they constitute one of the tools used in credit analysis. As such, these ratios are commonly used by the rating agencies in their assessments. Exhibit 5 illustrates the correlation between debt capacity- related ratios and assigned credit rating. For example, for Aa-rated bondsinterest-coverage ratios average nearly 14 times, whereas for Ba-rated bonds, the coverage ratio is less than 4 times. Similarly, companies with the highest ratings have debt-to-EBITDA ratios that are less than 2 times, whereas for Ba-rated companies, the debt-to-EBITDA ratio is nearly 4 times. Credit-Risk Premium Investors require higher return from borrowers with greater credit risk. Exhibit 6 provides a sampling of bonds across various industries and credit rating. The exhibit provides the coupon rate and the maturity year for each bond. The yield is calculated as the implied rate of return based on the prevailing market price for the bond and the promised coupon payments. The sample provides an opportunity to see how much bond yields increase for bonds with lower credit ratings. We see that the yield on the A-rated bonds ranges between 5.4% and 6.0%. The yield on the Baa-rated bonds is between 6.3% and 7.4%. The yield on the B-rated bonds ranges between 8.5% and 9.4%, and the yield on the C-rated bond is 11.6%. The sample of bond yields gives a good example of the risk premium that lenders require to lend to those with more credit risk. We can use the 2.7% yield on prevailing government bonds as a risk-free benchmark to calculate the specific risk premium using average yields for each bond rating category (Table 1). Table 1. Specific risk premium calculations for bond rating categories. Credit Rating Approximate Risk Premium Calculation A 3.0% = 5.7% - 2.7% Baa 300 bps 400 bps 630 bps 4.0%= 6.7% - 2.7% B 6.3% = 9.0% - 2.7% C 890 bps 8.9% = 11.6% - 2.7% Source: Created by author based on data from US Treasury and Mergent Bond Record, Mergent Inc. (April 2018) The sample of bond yields gives a good example of the risk premium that lenders require to lend to those with more credit risk. We can use the 2.7% yield on prevailing government bonds as a risk-free benchmark to calculate the specific risk premium using average yields for each bond rating category (Table 1). Table 1. Specific risk premium calculations for bond rating categories. Credit Rating Approximate Risk Premium Calculation A 3.0% = 5.7% 2.7% Baa 4.0% = 6.7% - 2.7% 300 bps 400 bps 630 bps 890 bps B 6.3% = 9.0% - 2.7% = 8.9% = 11.6% - 2.7% Source: Created by author based on data from US Treasury and Mergent Bond Record, Mergent Inc. (April 2018). a Investors in the A-rated bonds tend to require a risk premium of about 300 bps, whereas the risk premium is about 400 bps for the Baa-rated bonds, about 630 bps for the B-rated bonds, and 890 bps for the C-rated bonds. In this way, the credit rating can be highly informative in ascertaining the expected yields associated with credit ratings. Page 7 UV8009 Exhibit 1 Credit Analysis Basics Financial Statement for Helgason Veii (figures in millions of Icelandic krona) 2015 2016 2017 Income Statement (1) Revenue (2) Operating costs (3) Operating profit (4) Interest Expense (5) Pretax profit (6) Income taxes (7) Net profit 33.5 29.3 4.2 0.0 4.2 2.1 2.1 23.3 22.9 0.4 0.0 0.4 0.2 0.2 30.2 27.2 3.0 0.0 3.0 1.5 1.5 Balance Sheet Assets (8) Cash (9) Net equipment (10) Total assets 1.9 9.4 11.3 1.4 8.8 10.2 2.9 8.1 11.0 Liabilities and Equity (11) Accounts payable (12) Wages payable (13) Debt (14) Equity (15) Total liabilities and equity 0.8 0.9 0.0 9.6 11.3 1.3 1.2 0.0 7.7 10.2 0.9 1.1 0.0 11.0 Legend (1) Revenue is the total amount of product sold for the year. (2) Operating costs are all the costs associated with harvesting and selling product including the salary for Mr. Helgason. (3) Operating profit is the difference between the Revenue and the Operating costs. (4) Interest expense is the interest payments of debt for the year. (5) Pretax profit is the difference between the Operating profit and the interest expense, which is tax-deductible. (6) Income taxes is the income taxes paid or accumulated for the year. (7) Net profit is the Pretax profit less the Income taxes. (8) Cash is the cash balance for the business as of the end of the year. (9) Net equipment is the Gross acquisition price of the fishing boat and all associated equipment less the accumulated depreciation. (10) Total assets is the total value of all of the asset accounts. (11) Accounts payable is the amount of bills owed to business suppliers (e.g., suppliers of bait). (12) Wages payable is the amount of wages owed employees at the end of the year. (13) Debt is the balance of debt owed at the end of the year. (14) Equity is the owner's equity investment in the business. (15) Total liabilities and equity is the total amount of funding at the end of the year. Source: Unless otherwise noted, all exhibits created by author. Exhibit 2 Credit Analysis Basics Pro-Forma 2018 Financial Statement for Helgason Veii with Additional Boat (figures in millions of Icelandic krona) Expected 2018 Income Statement Revenue Operating costs* Operating profit Interest Expense Pretax profit ome taxes Net profit 54.4 50.4 4.0 0.4 3.6 1.8 1.8 Balance Sheet Assets Cash Net equipment Total assets 1.9 14.1 16.0 Liabilities and Equity Accounts payable Wages payable Debt Equity Total liabilities and equity 1.6 2.0 5.0 7.4 16.0 Includes expected depreciation of ISK1 million. Page 9 UV8009 Exhibit 3 Credit Analysis Basics Credit-Rating Agency Rating Systems S&P/ Fitch System Rating Categories Moody's System Rating Categories Moody's Description Rated as the highest quality and lowest credit risk. Rated as high quality and very low credit risk. Investment Grade AAA AA+ AA AA- A+ A A- BBB+ BBB BBB- Aal Aa2 Aa3 A1 A2 A3 Baal Baa2 Baa3 Rated as upper-medium grade and low credit risk. Rated as medium grade, with some speculative elements and moderate credit risk. Speculative Grade BB+ BB BB Judged to have speculative elements and a significant credit risk. Bal Ba2 Ba3 BI B+ B2 B B- Judged as being speculative and a high credit risk. B3 CCC Caa Ca Rated as poor quality and very high credit risk. Judged to be highly speculative and with likelihood of being near or in default, but some possibility of recovering principal and interest. Rated as the lowest quality, usually in default and low likelihood of recovering principal or interest. Page 10 UV8009 Exhibit 4 Credit Analysis Basics Average 10-Year Default Rates for Global Corporate Bonds by Rating (19812016) 60% 50% 40% Default Rate 30% 20% 10% 0% AA A BBB BB B CCC/C Source: Author analysis of data provided by S&P Global Fixed Income Research and S&P CreditPro. Exhibit 5 Credit Analysis Basics Average Financial Ratios by Credit-Rating Category (December 2016) Revenue Volatility 6.8% Aaa 8.6% tasdien Interest Coverage 11.5 13.9 10.7 6.3 3.7 1.9 0.7 Debt to EBITDA 1.9 1.8 2.3 2.9 3.7 5.2 8.1 Debt to Capital 35% 31% 41% 46% 56% 66% 89% ROA 12.3% 10.2% 10.8% 8.7% 8.5% 6.7% 4.1% Baa 7.4% 10.7% 14.3% 18.7% 18.9% Caa - C Ratio Definitions Interest Coverage = EBITDA / Interest Expense Debt to EBITDA = Total ST and LT Debt / EBITDA Debt to Capital = Total ST and LT Debt / (Total ST and LT Debt + Deferred Taxes + Minority Interest + Book Equity) ROA = EBITDA / Average of Current and Previous Year Total Assets Revenue Volatility = Standard Deviation of Trailing Five Years of Net Revenue Growth = = Note: ST = short-term; LT = long-term. Source: Moody's Investor Services, September 2017. Page 11 UV8009 Exhibit 6 Credit Analysis Basics Prevailing Bond Yields for US Government and Corporate Borrowers Corporate Borrowers Bond Characterisitcs Coupon Rating Borrower Industry Maturity Yield A2 A2 Avista Consolidated Edison John Deere Baxter Phelps Dodge Goodyear Tire RR Donnelley Sears Roebuck Energy Energy Equipment Health care Mining Tire manufacturing Business communication Retail 2035 2038 2031 2028 2027 2028 2031 2028 6.25% 6.75% 7.13% 6.63% 7.13% 7.00% 8.82% 6.75% A2 Baal Baa3 B1 5.96% 5.61% 5.37% 6.27% 7.36% 8.48% 9.43% 11.61% B2 Government Borrowers US Treasury Yield 2.73% 10 Year Data sources: US Treasury April 2018: Mergent Bond Record Mergent Inc. April 2018 Credit Analysis Basics Capital markets facilitate the appropriate exchange of money. For lenders and borrowers, the interest rate is the primary pricing mechanism that markets use in this exchange. For borrowers deemed to have higher credit risk, lenders add a risk premium to the interest rate to compensate for higher risk. Credit risk is the risk that the borrower will default on (not pay) the payments agreed upon in the loan. Such risk-based interest rates ensure that money flows appropriately between lenders and borrowers. Credit analysis is the process of determining a potential borrower's credit risk. This note explores credit analysis and its relation to the credit-risk premium in interest rates. A Second Boat for Helgason Veii Iceland native Gunnar Helgason was a fisherman who worked out of Reykjavk. His fishing company, Helgason Veii, specialized harvesting North Atlantic cod and mackerel. The business had been highly successful, as detailed in its current financial statements (see Exhibit 1). The income statement captured the aggregate revenue and costs throughout the year; it indicated that Helgason Veiis revenue had varied from ISK34 million in 2015, to ISK23 million in 2016, then to ISK30 million in 2017.1 In 2017, the net profits of the business after deducting all expenses had been ISK1.5 million. While the income statement captured the volume of business activity over the year, the balance sheet provided a snapshot of the assets and liabilities of the business at the end of the year. At the end of 2017, the book value of Helgason's total assets was ISK11 million, most of which was his boat and fishing equipment. As he had little in terms of debt and other obligations, his equity position in the company totaled ISK9 million. Helgason wanted to grow the business by buying a second boat that his son would operate. The cost of acquiring a new fishing boat and the associated equipment was anticipated to run ISK6 million. Helgason expected that the second boat would increase company revenue by 80%. Using his financial modeling skills, Helgason created pro-forma financial statements for 2018 that reflected the expected impact of the additional boat. In the model he asserted that ISK5 million of the ISK6 million boat purchase expenditure would be funded with a new 10-year loan. Based on his analysis, Helgason believed that adding the boat made sense as long as the interest rate on the loan was not above 6%. Considering his strong business history, Helgason assumed that he could get the financing on good terms from his longtime friend, Jkull Rafnkelsson, who managed a branch of a local bank that specialized in lending to the fishing industry. Helgason emailed Rafnkelsson his request, invited him to lunch the next day at the Ljffengur Frysta, and attached his analysis along with some photos of some large catches he had recently made. Rafnkelsson accepted the lunch invitation and began to look over the numbers. Participants in financial markets generally come to a transaction with different sets of information. This asymmetry in information can have important implications for how markets function. One solution to this problem is the development of intermediaries that bridge the information asymmetry between market participants. As an example, suppose that 19-year-old Doris is considering purchasing her first car. Perusing the online used-car postings, she sees an older Toyota Corolla that appears to meet her needs perfectly and is being sold on a best-offer basis by a person named Lily. Doing some research, Doris considers that there are roughly three possible values for the car. First, the car might be in good condition and worth $8,000. Second, the car might be in average condition and worth $4,000. Lastly, the car might be a "lemon and worth nothing. She believes that each condition has equal probability. Her initial thought is to offer Lily $4,000 for the car. The $4,000 represents the expected value of the car based on the probabilities of the various conditions.2 On second thought, she realizes that Lily would accept an offer of $4,000 only if Lily believes that the car is worth no more than that. Recognizing this, Doris considers offering $2,000, equal to the conditional expected value of the average and lemon condition. But on reflection she realizes that Lily would accept the $2,000 offer only if the car is not worth more than $2,000. Realizing that with such differences in information she is bound to get a lemon, Doris considers giving up and just buying a bus pass. Because of the differences in information held by the buyer and seller, the buyer is never willing to offer the value of the car, and the market is destined to fail. Doris complains to her brother Justin, who recommends that she employ the services of an intermediary to provide an objective assessment of the car's condition, such as his friend, an auto mechanic. She follows Justin's recommendation. The mechanic takes a look at the car and declares it to be in good condition. Bolstered by the added information, Doris offers $8,000 for the Corolla and the seller accepts it. Doris has wheels and Lily has cashthe mechanic has saved the day by bridging the information gap. Banks play a similar role, acting as intermediaries between those with excess cash and those with insufficient cash. Those with insufficient cash would like to borrow money from those with excess cash. But because of asymmetric information, those with excess cash are unable to distinguish the creditworthy from the noncreditworthy borrowers. Lenders face an adverse selection concern, as they fear that only those with bad creditworthiness will borrow at average rates. Lenders need to assess the probability that a borrower defaults (fails to make the specified payments), but the cost of that assessment is too high. Instead, the bank saves the day: it aggregates money from those with excess cash and then uses its larger scale to cost-effectively assess the creditworthiness of borrowers. With the added information of these assessments, the bank can naturally adjust the price of a loan to reflect the probability of default and thereby allow for the appropriate credit risk. A lender faces two generic outcomes from a loan: (1) payment, in which the borrower pays the lender the stated interest payments and principal as agreed; or (2) default, in which the lender fails to make the payments and seeks to renegotiate the loan agreement, commonly through a bankruptcy court. In order for the lender to appropriately price a loan, they need an assessment of a borrower's credit risk (the likelihood that the borrower will fail to make the payments). The lender naturally requires more return (e.g., interest) on a loan from a borrower with high credit risk than from a borrower with low credit risk. The additional return required by the lender for bearing the credit risk is called the risk premium. In evaluating credit risk, a common credit-analysis framework is the "five Cs. These five principal considerations in credit-risk assessment are: Page 3 UV8009 . Character. A lender assesses the borrower's integrity and the likelihood that they will pay their financial obligations. A related consideration is the borrower's business capabilities and the probability that their decisions will lead to the financial success of their business. Cash flow. A lender evaluates whether the borrower has or is expected to have sufficient income to repay the loan. Financial ratios such as coverage ratios (discussed below) are common tools to evaluate their capacity for repayment. Condition. A lender evaluates the current conditions of the business, industry, and economy, and how each impacts loan-repayment probability. This assessment includes expectations both for condition deterioration and for potential swings in those conditions. Understanding the downside business risk for the borrower is important to understanding their condition. Capital. A lender considers the amount of investment that the borrower has in the business or asset. This assessment helps establish any conflicting incentives the borrower may have with the lender. Lenders feel more comfortable with borrowers' incentives when they have money invested or skin in the game. Collateral. A lender considers assets the borrower will pledge in the loan as collateral that can be used as a secondary source of repayment. Not all loans have collateral, but the existence of collateral improves the terms of the loan. . An assessment across these five considerations helps the lender establish a credit-risk profile for the borrower. This profile is used to establish the risk premium appropriate for the interest rate. Credit Pricing in Reykjavk With a beautiful office view of Faxafli Bay and Mount Esja in the background, Rafnkelsson went to work evaluating the credit risk of the Helgason loan. Rafnkelsson appreciated the ups and downs of the community fishing industry, and he understood that while the industry's condition was currently robust, conditions changed easily and quickly. He had known Helgason for a long time and considered him a man of his word, one of the more productive fishermen on the wharf, and extremely headstrong. He recognized that Helgason's business success followed from his personal productivity. This performance was reflected in the financial statements. When evaluating debt capacity, Rafnkelsson had two favorite coverage ratios that he calculated: the interest-coverage ratio and the debt-to- EBITDA ratio. EBITDAa commonly used abbreviation for earnings before interest, taxes, depreciation, and amortizationis a measure of profits or cash flow. It is included in both coverage ratios Rafnkelsson used. These ratios are defined as follows: EBITDAa commonly used abbreviation for earnings before interest, taxes, depreciation, and amortizationis a measure of profits or cash flow. It is included in both coverage ratios Rafnkelsson used. These ratios are defined as follows: Interest Coverage ratio EBITDA / Interest Expense Debt-to-EBITDA ratio = Total Debt / EBITDA The interest-coverage ratio represents a multiple of the times that the interest expense was covered by the operating cash flow. If the interest-coverage ratio is 1, that means that the business has just enough operating profit to cover the interest expenses without any buffer. If the interest-coverage ratio is 2, then the business has twice the operating profit needed to cover the interest expenses. If the interest-coverage ratio is 0.5, then the business has half the operating profit needed to cover the annual interest expenses. With the tremendous Page 4 UV8009 volatility in operating profits experienced by small fishing businesses, Rafnkelsson liked to see very strong coverage ratios of his fishing borrowers. The debt-to-EBITDA ratio provides a similar intuition of the borrower's level of indebtedness. This ratio indicates how many years of annual cash flow are required to meet the debt obligations of the business. As with any coverage ratio, the interpretation of debt-to-EBITDA ratios depends strongly on the stability of the business or industry profits. Based on the pro-forma financials Helgason provided (see Exhibit 2), Rafnkelsson calculated the interest- coverage ratio at 12.5 times (EBITDA of 5.0 / interest expense of 0.4; note that EBITDA was equal to ISK5 million, which is ISK4 million in EBIT plus ISK1 million in depreciation) and the debt-to-EBITDA ratio at 1.0 (debt of 5.0 / EBITDA of 5.0). While at first pass these numbers looked more than adequate, Rafnkelsson appreciated how quickly these ratios could deteriorate with a decline in fishing catch rates. To model Helgason's vulnerability, Rafnkelsson adjusted the revenue line to reflect a 10% decline in revenue, from ISK54.4 million to ISK48.9 million. Since the operating costs would remain largely unchanged in such a decline, the 10% revenue decline reduced the healthy operating profit of ISK4 million to negative ISK1.5 million. In such a scenario, Helgason could probably manage to pay the interest from his cash account. But if the decline in revenue were larger, or small but persistent, there would come a point where he would default on the payment. Such a scenario did not seem all that improbable and emphasized how sensitive business profits were to small declines in fishing volume. Rafnkelsson appreciated that Helgason had a lot of his own money in the business. He knew that Helgason owned Helgason Veii exclusively, and that he hoped to pass on his equity in the business to his son. Helgason would likely do everything possible to maintain the viability of the Helgason Veii and not lose control of the business in a bankruptcy settlement. Rafnkelsson expected to ask that the new boat be posted as collateral on the loan. While this condition provided some valuable recourse for the bank, it failed to neutralize such risks as losing the boat in a North Atlantic storm. In such a situation, Helgason Veii would not only be short on cash to repay the loan, but the bank would also be without recourse to repossess its collateral. Based on this credit analysis, Rafnkelsson considered the deal as possessing average credit risk for a fishing business loan in Reykjavk. For loans with such risk, he commonly attached a risk premium of 300 basis points (bps).3 To get the interest rate, this premium was added to the prevailing government borrowing rate in Iceland. Since the yield on 10-year vernment debt was currently trading in Iceland at 4%, Rafnkelsson felt that a 7% fixed-interest rate was an appropriate rate for a 10-year loan to Helgason (the difference between the 7% and 4% rates represented the 300 bp risk premium). Back at the Ljffengur Frysta The next day, Helgason and Rafnkelsson, along with Helgason's son Bjrn, met at the Ljffengur Frysta for lunch. Helgason and Rafnkelsson were both men of few words. After enjoying a traditional lamb soup for nearly an hour in complete silence, Helgason put down his spoon and asked Rafnkelsson the big question, "Hvaa hlutfall? Rafnkelsson looked up from his soup and announced his interest rate offer on the proposed loan with the resolute composure of a seasoned banker, 7%. 7%!, erupted Helgason. a er alger rn stafli af rottandi fiski rmum!, he thundered, which could roughly be translated as That's total robbery you stinking pile of rotten fish entrails! Helgason stormed out 3 A basis point (bp) is defined as one 100th of a percentage point. Page 5 UV8009 of the restaurant, face red with rage and scorn. Bjrn and Rafnkelsson looked back at their soup and finished the meal, then Rafnkelsson gave Bjrn a ride home. Corporate Bonds An alternative to the bank loan market, the corporate bond market is an important source of credit for businesses of sufficient scale. In the bond market, companies divide their total borrowing need into smaller, tradable financial securities (e.g., $1,000). Companies sell these bond securities to investors through an intermediary called an investment bank that connects the borrower to a large number of investors interested in buying the bonds. The investment bank advises the company on the terms of the bond, including the interest rate (also known in bond vocabulary as the coupon rate). a Just as Rafnkelsson did a credit-risk assessment of Helgason's loan, corporate bond investors also require credit-risk analysis. However, with millions of different corporate bonds trading in financial markets, corporate- bond risk assessment is a daunting challenge. To facilitate efficient processing of corporate-bond credit-risk assessments, credit-rating agencies emerged in the early 1900s to centralize this process. Since then, agencies such as Moody's, Fitch, and Standard & Poor's have been active in providing default-risk assessments for a large number of corporate bonds. The credibility of credit-risk analysis by credit-rating agencies depends wholly on their incentives to maintain strong reputations. The credit-rating agencies stay in business only if people believe they are proficient at credit analysis. Credit-rating agencies generate their revenue primarily through the fees they charge companies to rate the companies' bonds. Companies are willing to pay the rating fees because having a rating (even a bad rating) tends to lower their cost of borrowing. This may be because investors are wary of unrated bonds, as suggested by the example of Doris's worry about making a nave offer on a used car. In theory, rating fees are kept in check by the competitive forces between the three primary rating agencies. Quality is maintained by the critical nature of reputational capital in this industry.4 The credit assessment provided by these agencies has been standardized into what is called a credit rating. The credit rating is a standardized assessment of the credit risk associated with a borrower or a particular bond. The rating agencies follow letter-based formats for denoting their ratings (Exhibit 3 provides details on the full range of rating categories). For S&P and Fitch ratings, low-risk bonds (called investment grade bonds) are denoted by the ratings AAA, AA, A, or BBB. Among investment-grade bonds, AAA-denoted bonds are considered to have the lowest risk of default, and BBB-rated bonds are considered to have the highest risk of default. High-risk bonds (called speculative grade or junk bonds) are denoted by the ratings BB, B, CCC, CC, and C. Among speculative-grade bonds, BB-denoted bonds are considered to have the lowest credit risk among the speculative-grade bonds, and C-rated bonds are considered to have the highest credit risk. Moody's follows a mostly similar rating system, where, for example, the rating Baa is equivalent to the rating BBB in the S&P/Fitch system. To provide more detail on their ratings, the rating agencies refine their broad ratings with "notching." Notching adds additional grades to the broad letter grades. In the S&P/ Fitch system, a _ is added to the letter grade. A+ is a little safer rating and A is a little riskier rating than A. For Moody's, a 1, 2, or 3 is added, with 1 being the better rating and 3 the poorer rating. For example, a BBB-or Baa3 rating is the lowest investment-grade bond rating under the S&P/Fitch system and Moody's system, respectively. a + or a Like any expert service, the various rating agencies compete on their ability to provide expert knowledge at efficient costs. Investors tend to trust the agency that appears to be best at correctly predicting default rates. Exhibit 4 provides some evidence of the average rates of default over the various categories of S&P ratings. The exhibit shows that the default rate over a 10-year horizon climbs from effectively zero for the high-grade 4 Following the 20078 financial crisis, the rating agencies came under heavy scrutiny for what was widely perceived as a failure in the quality of the credit ratings assigned to securitized housing mortgages. These allegations led to several lawsuits and settlements by the rating agencies for their ratings during this time. Such legal and reputational penalties create a strong long-term incentive for rating agencies to maintain fair and accurate ratings. Page 6 UV8009 bonds, to 4% for the BBB-rated bonds, and 25% for the B-rated bonds. The historical evidence indicates that cumulative default rates increase for corporate bonds as the initial S&P rating category becomes poorer. The five considerations, as represented by the five Cs, would naturally be part of a credit assessment by a rating agency, and they constitute one of the tools used in credit analysis. As such, these ratios are commonly used by the rating agencies in their assessments. Exhibit 5 illustrates the correlation between debt capacity- related ratios and assigned credit rating. For example, for Aa-rated bondsinterest-coverage ratios average nearly 14 times, whereas for Ba-rated bonds, the coverage ratio is less than 4 times. Similarly, companies with the highest ratings have debt-to-EBITDA ratios that are less than 2 times, whereas for Ba-rated companies, the debt-to-EBITDA ratio is nearly 4 times. Credit-Risk Premium Investors require higher return from borrowers with greater credit risk. Exhibit 6 provides a sampling of bonds across various industries and credit rating. The exhibit provides the coupon rate and the maturity year for each bond. The yield is calculated as the implied rate of return based on the prevailing market price for the bond and the promised coupon payments. The sample provides an opportunity to see how much bond yields increase for bonds with lower credit ratings. We see that the yield on the A-rated bonds ranges between 5.4% and 6.0%. The yield on the Baa-rated bonds is between 6.3% and 7.4%. The yield on the B-rated bonds ranges between 8.5% and 9.4%, and the yield on the C-rated bond is 11.6%. The sample of bond yields gives a good example of the risk premium that lenders require to lend to those with more credit risk. We can use the 2.7% yield on prevailing government bonds as a risk-free benchmark to calculate the specific risk premium using average yields for each bond rating category (Table 1). Table 1. Specific risk premium calculations for bond rating categories. Credit Rating Approximate Risk Premium Calculation A 3.0% = 5.7% - 2.7% Baa 300 bps 400 bps 630 bps 4.0%= 6.7% - 2.7% B 6.3% = 9.0% - 2.7% C 890 bps 8.9% = 11.6% - 2.7% Source: Created by author based on data from US Treasury and Mergent Bond Record, Mergent Inc. (April 2018) The sample of bond yields gives a good example of the risk premium that lenders require to lend to those with more credit risk. We can use the 2.7% yield on prevailing government bonds as a risk-free benchmark to calculate the specific risk premium using average yields for each bond rating category (Table 1). Table 1. Specific risk premium calculations for bond rating categories. Credit Rating Approximate Risk Premium Calculation A 3.0% = 5.7% 2.7% Baa 4.0% = 6.7% - 2.7% 300 bps 400 bps 630 bps 890 bps B 6.3% = 9.0% - 2.7% = 8.9% = 11.6% - 2.7% Source: Created by author based on data from US Treasury and Mergent Bond Record, Mergent Inc. (April 2018). a Investors in the A-rated bonds tend to require a risk premium of about 300 bps, whereas the risk premium is about 400 bps for the Baa-rated bonds, about 630 bps for the B-rated bonds, and 890 bps for the C-rated bonds. In this way, the credit rating can be highly informative in ascertaining the expected yields associated with credit ratings. Page 7 UV8009 Exhibit 1 Credit Analysis Basics Financial Statement for Helgason Veii (figures in millions of Icelandic krona) 2015 2016 2017 Income Statement (1) Revenue (2) Operating costs (3) Operating profit (4) Interest Expense (5) Pretax profit (6) Income taxes (7) Net profit 33.5 29.3 4.2 0.0 4.2 2.1 2.1 23.3 22.9 0.4 0.0 0.4 0.2 0.2 30.2 27.2 3.0 0.0 3.0 1.5 1.5 Balance Sheet Assets (8) Cash (9) Net equipment (10) Total assets 1.9 9.4 11.3 1.4 8.8 10.2 2.9 8.1 11.0 Liabilities and Equity (11) Accounts payable (12) Wages payable (13) Debt (14) Equity (15) Total liabilities and equity 0.8 0.9 0.0 9.6 11.3 1.3 1.2 0.0 7.7 10.2 0.9 1.1 0.0 11.0 Legend (1) Revenue is the total amount of product sold for the year. (2) Operating costs are all the costs associated with harvesting and selling product including the salary for Mr. Helgason. (3) Operating profit is the difference between the Revenue and the Operating costs. (4) Interest expense is the interest payments of debt for the year. (5) Pretax profit is the difference between the Operating profit and the interest expense, which is tax-deductible. (6) Income taxes is the income taxes paid or accumulated for the year. (7) Net profit is the Pretax profit less the Income taxes. (8) Cash is the cash balance for the business as of the end of the year. (9) Net equipment is the Gross acquisition price of the fishing boat and all associated equipment less the accumulated depreciation. (10) Total assets is the total value of all of the asset accounts. (11) Accounts payable is the amount of bills owed to business suppliers (e.g., suppliers of bait). (12) Wages payable is the amount of wages owed employees at the end of the year. (13) Debt is the balance of debt owed at the end of the year. (14) Equity is the owner's equity investment in the business. (15) Total liabilities and equity is the total amount of funding at the end of the year. Source: Unless otherwise noted, all exhibits created by author. Exhibit 2 Credit Analysis Basics Pro-Forma 2018 Financial Statement for Helgason Veii with Additional Boat (figures in millions of Icelandic krona) Expected 2018 Income Statement Revenue Operating costs* Operating profit Interest Expense Pretax profit ome taxes Net profit 54.4 50.4 4.0 0.4 3.6 1.8 1.8 Balance Sheet Assets Cash Net equipment Total assets 1.9 14.1 16.0 Liabilities and Equity Accounts payable Wages payable Debt Equity Total liabilities and equity 1.6 2.0 5.0 7.4 16.0 Includes expected depreciation of ISK1 million. Page 9 UV8009 Exhibit 3 Credit Analysis Basics Credit-Rating Agency Rating Systems S&P/ Fitch System Rating Categories Moody's System Rating Categories Moody's Description Rated as the highest quality and lowest credit risk. Rated as high quality and very low credit risk. Investment Grade AAA AA+ AA AA- A+ A A- BBB+ BBB BBB- Aal Aa2 Aa3 A1 A2 A3 Baal Baa2 Baa3 Rated as upper-medium grade and low credit risk. Rated as medium grade, with some speculative elements and moderate credit risk. Speculative Grade BB+ BB BB Judged to have speculative elements and a significant credit risk. Bal Ba2 Ba3 BI B+ B2 B B- Judged as being speculative and a high credit risk. B3 CCC Caa Ca Rated as poor quality and very high credit risk. Judged to be highly speculative and with likelihood of being near or in default, but some possibility of recovering principal and interest. Rated as the lowest quality, usually in default and low likelihood of recovering principal or interest. Page 10 UV8009 Exhibit 4 Credit Analysis Basics Average 10-Year Default Rates for Global Corporate Bonds by Rating (19812016) 60% 50% 40% Default Rate 30% 20% 10% 0% AA A BBB BB B CCC/C Source: Author analysis of data provided by S&P Global Fixed Income Research and S&P CreditPro. Exhibit 5 Credit Analysis Basics Average Financial Ratios by Credit-Rating Category (December 2016) Revenue Volatility 6.8% Aaa 8.6% tasdien Interest Coverage 11.5 13.9 10.7 6.3 3.7 1.9 0.7 Debt to EBITDA 1.9 1.8 2.3 2.9 3.7 5.2 8.1 Debt to Capital 35% 31% 41% 46% 56% 66% 89% ROA 12.3% 10.2% 10.8% 8.7% 8.5% 6.7% 4.1% Baa 7.4% 10.7% 14.3% 18.7% 18.9% Caa - C Ratio Definitions Interest Coverage = EBITDA / Interest Expense Debt to EBITDA = Total ST and LT Debt / EBITDA Debt to Capital = Total ST and LT Debt / (Total ST and LT Debt + Deferred Taxes + Minority Interest + Book Equity) ROA = EBITDA / Average of Current and Previous Year Total Assets Revenue Volatility = Standard Deviation of Trailing Five Years of Net Revenue Growth = = Note: ST = short-term; LT = long-term. Source: Moody's Investor Services, September 2017. Page 11 UV8009 Exhibit 6 Credit Analysis Basics Prevailing Bond Yields for US Government and Corporate Borrowers Corporate Borrowers Bond Characterisitcs Coupon Rating Borrower Industry Maturity Yield A2 A2 Avista Consolidated Edison John Deere Baxter Phelps Dodge Goodyear Tire RR Donnelley Sears Roebuck Energy Energy Equipment Health care Mining Tire manufacturing Business communication Retail 2035 2038 2031 2028 2027 2028 2031 2028 6.25% 6.75% 7.13% 6.63% 7.13% 7.00% 8.82% 6.75% A2 Baal Baa3 B1 5.96% 5.61% 5.37% 6.27% 7.36% 8.48% 9.43% 11.61% B2 Government Borrowers US Treasury Yield 2.73% 10 Year Data sources: US Treasury April 2018: Mergent Bond Record Mergent Inc. April 2018