Your assignment is to use your intuition, common sense, and basic understanding of the unique attributes of each industry listed above to match each column in the exhibit with one of the industries. Write out the reasons for your pairings, citing the data that seems to be consistent with the characteristics of the industry you selected. Ours is not a perfect world, however, and for our class discussion, it will be helpful if you will also identify those pieces of data that seem to contradict the pairings you have made.
Please include a clear answer for each assumption.
| Retailer | Industrial |
| Chemical | Packaged Food |
| Integrated Oil | Utility |
| Technology | Financial Services |
| Pharmaceutical | |
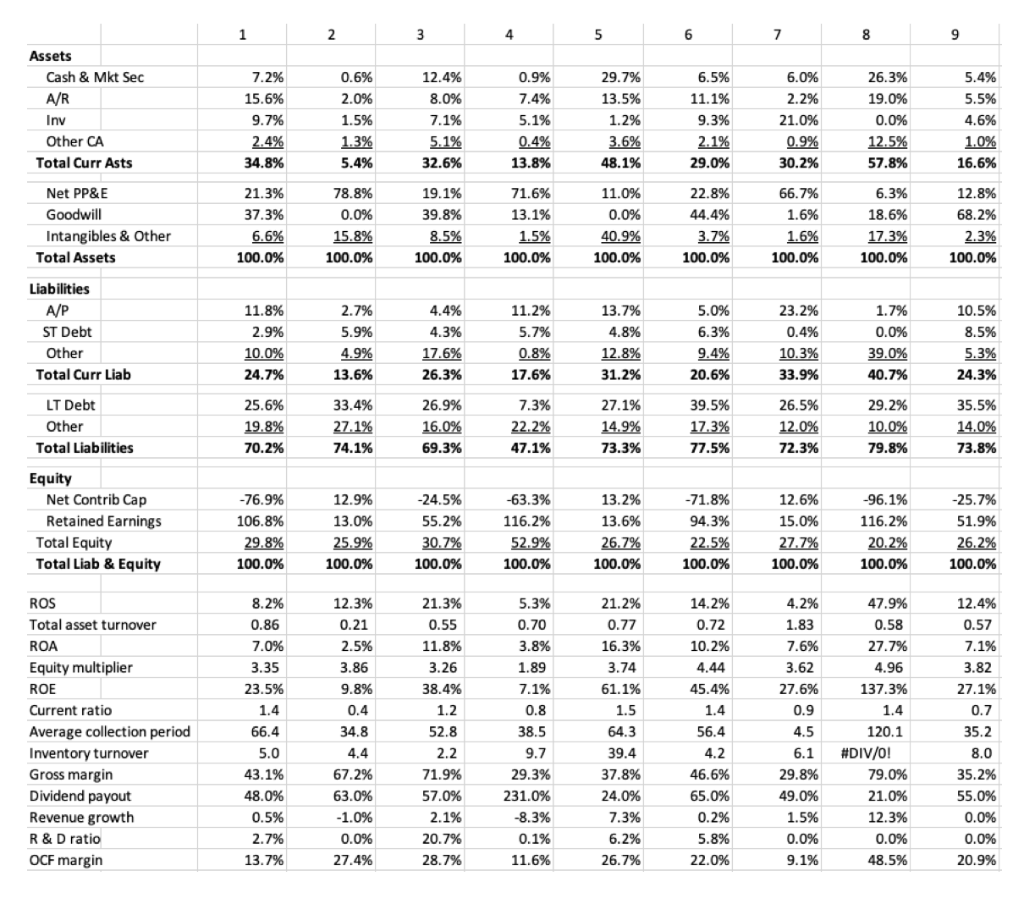
1 2 3 4 5 6 7 8 9 Assets Cash & Mkt Sec A/R Inv Other CA Total Curr Asts 7.2% 15.6% 9.7% 2.4% 34.8% 0.6% 2.0% 1.5% 1.3% 5.4% 12.4% 8.0% 7.1% 5.1% 32.6% 0.9% 7.4% 5.1% 0.4% 13.8% 29.7% 13.5% 1.2% 3.6% 48.1% 6.5% 11.1% 9.3% 2.1% 29.0% 6.0% 2.2% 21.0% 0.9% 30.2% 26.3% 19.0% 0.0% 12.5% 57.8% 5.4% 5.5% 4.6% 1.0% 16.6% Net PP&E Goodwill Intangibles & Other Total Assets 21.3% 37.3% 6.6% 100.0% 78.8% 0.0% 15.8% 100.0% 19.1% 39.8% 8.5% 100.0% 71.6% 13.1% 1.5% 100.0% 11.0% 0.0% 40.9% 100.0% 22.8% 44.4% 3.7% 100.0% 66.7% 1.6% 1.6% 100.0% 6.3% 18.6% 17.3% 100.0% 12.8% 68.2% 2.3% 100.0% Liabilities A/P ST Debt Other Total Curr Liab 11.8% 2.9% 10.0% 24.7% 2.7% 5.9% 4.9% 13.6% 4.4% 4.3% 17.6% 26.3% 11.2% 5.7% 0.8% 17.6% 13.7% 4.8% 12.8% 31.2% 5.0% 6.3% 9.4% 20.6% 23.2% 0.4% 10.3% 33.9% 1.7% 0.0% 39.0% 40.7% 10.5% 8.5% 5.3% 24.3% LT Debt Other Total Liabilities 25.6% 19.8% 70.2% 33.4% 27.1% 74.1% 26.9% 16.0% 69.3% 7.3% 22.2% 47.1% 27.1% 14.9% 39.5% 17.3% 77.5% 26.5% 12.0% 72.3% 29.2% 10.0% 79.8% 35.5% 14.0% 73.8% 73.3% Equity Net Contrib Cap Retained Earnings Total Equity Total Liab & Equity -76.9% 106.8% 29.8% 100.0% 12.9% 13.0% 25.9% -24.5% 55.2% 30.7% 100.0% -63.3% 116.2% 52.9% 100.0% 13.2% 13.6% 26.7% 100.0% -71.8% 94.3% 22.5% 100.0% 12.6% 15.0% 27.7% 100.0% -96.1% 116.2% 20.2% 100.0% -25.7% 51.9% 26.2% 100.0% 100.0% ROS Total asset turnover ROA Equity multiplier ROE Current ratio Average collection period Inventory turnover Gross margin Dividend payout Revenue growth R&D ratio OCF margin 8.2% 0.86 7.0% 3.35 23.5% 1.4 66.4 5.0 43.1% 48.0% 0.5% 2.7% 13.7% 12.3% 0.21 2.5% 3.86 9.8% 0.4 34.8 4.4 67.2% 63.0% -1.0% 0.0% 27.4% 21.3% 0.55 11.8% 3.26 38.4% 1.2 52.8 2.2 71.9% 57.0% 2.1% 20.7% 28.7% 5.3% 0.70 3.8% 1.89 7.1% 0.8 38.5 9.7 29.3% 231.0% -8.3% 0.1% 11.6% 21.2% 0.77 16.3% 3.74 61.1% 1.5 64.3 39.4 37.8% 24.0% 7.3% 6.2% 26.7% 14.2% 0.72 10.2% 4.44 45.4% 1.4 56.4 4.2 46.6% 65.0% 0.2% 5.8% 22.0% 4.2% 1.83 7.6% 3.62 27.6% 0.9 4.5 6.1 29.8% 49.0% 1.5% 0.0% 9.1% 47.9% 0.58 27.7% 4.96 137.3% 1.4 120.1 #DIV/0! 79.0% 21.0% 12.3% 0.0% 48.5% 12.4% 0.57 7.1% 3.82 27.1% 0.7 35,2 8.0 35.2% 55.0% 0.0% 0.0% 20.9% 1 2 3 4 5 6 7 8 9 Assets Cash & Mkt Sec A/R Inv Other CA Total Curr Asts 7.2% 15.6% 9.7% 2.4% 34.8% 0.6% 2.0% 1.5% 1.3% 5.4% 12.4% 8.0% 7.1% 5.1% 32.6% 0.9% 7.4% 5.1% 0.4% 13.8% 29.7% 13.5% 1.2% 3.6% 48.1% 6.5% 11.1% 9.3% 2.1% 29.0% 6.0% 2.2% 21.0% 0.9% 30.2% 26.3% 19.0% 0.0% 12.5% 57.8% 5.4% 5.5% 4.6% 1.0% 16.6% Net PP&E Goodwill Intangibles & Other Total Assets 21.3% 37.3% 6.6% 100.0% 78.8% 0.0% 15.8% 100.0% 19.1% 39.8% 8.5% 100.0% 71.6% 13.1% 1.5% 100.0% 11.0% 0.0% 40.9% 100.0% 22.8% 44.4% 3.7% 100.0% 66.7% 1.6% 1.6% 100.0% 6.3% 18.6% 17.3% 100.0% 12.8% 68.2% 2.3% 100.0% Liabilities A/P ST Debt Other Total Curr Liab 11.8% 2.9% 10.0% 24.7% 2.7% 5.9% 4.9% 13.6% 4.4% 4.3% 17.6% 26.3% 11.2% 5.7% 0.8% 17.6% 13.7% 4.8% 12.8% 31.2% 5.0% 6.3% 9.4% 20.6% 23.2% 0.4% 10.3% 33.9% 1.7% 0.0% 39.0% 40.7% 10.5% 8.5% 5.3% 24.3% LT Debt Other Total Liabilities 25.6% 19.8% 70.2% 33.4% 27.1% 74.1% 26.9% 16.0% 69.3% 7.3% 22.2% 47.1% 27.1% 14.9% 39.5% 17.3% 77.5% 26.5% 12.0% 72.3% 29.2% 10.0% 79.8% 35.5% 14.0% 73.8% 73.3% Equity Net Contrib Cap Retained Earnings Total Equity Total Liab & Equity -76.9% 106.8% 29.8% 100.0% 12.9% 13.0% 25.9% -24.5% 55.2% 30.7% 100.0% -63.3% 116.2% 52.9% 100.0% 13.2% 13.6% 26.7% 100.0% -71.8% 94.3% 22.5% 100.0% 12.6% 15.0% 27.7% 100.0% -96.1% 116.2% 20.2% 100.0% -25.7% 51.9% 26.2% 100.0% 100.0% ROS Total asset turnover ROA Equity multiplier ROE Current ratio Average collection period Inventory turnover Gross margin Dividend payout Revenue growth R&D ratio OCF margin 8.2% 0.86 7.0% 3.35 23.5% 1.4 66.4 5.0 43.1% 48.0% 0.5% 2.7% 13.7% 12.3% 0.21 2.5% 3.86 9.8% 0.4 34.8 4.4 67.2% 63.0% -1.0% 0.0% 27.4% 21.3% 0.55 11.8% 3.26 38.4% 1.2 52.8 2.2 71.9% 57.0% 2.1% 20.7% 28.7% 5.3% 0.70 3.8% 1.89 7.1% 0.8 38.5 9.7 29.3% 231.0% -8.3% 0.1% 11.6% 21.2% 0.77 16.3% 3.74 61.1% 1.5 64.3 39.4 37.8% 24.0% 7.3% 6.2% 26.7% 14.2% 0.72 10.2% 4.44 45.4% 1.4 56.4 4.2 46.6% 65.0% 0.2% 5.8% 22.0% 4.2% 1.83 7.6% 3.62 27.6% 0.9 4.5 6.1 29.8% 49.0% 1.5% 0.0% 9.1% 47.9% 0.58 27.7% 4.96 137.3% 1.4 120.1 #DIV/0! 79.0% 21.0% 12.3% 0.0% 48.5% 12.4% 0.57 7.1% 3.82 27.1% 0.7 35,2 8.0 35.2% 55.0% 0.0% 0.0% 20.9%