

Question
Your task is to write a MATLAB program that solves and simulates the graphics of the GaussSeidel and Jacobi solutions for the following linear equation
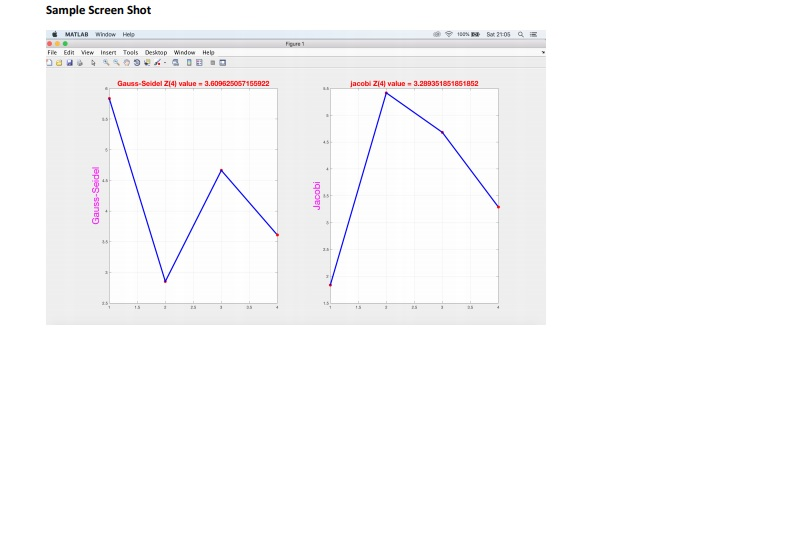
Your task is to write a MATLAB program that solves and simulates the graphics of the GaussSeidel and Jacobi solutions for the following linear equation system by using the template given to you on lectures during the week of April 9 15. The name of the template is: comparison_of_iterartive_methods. Download the template and modify it for Gauss-Seidel and Jacobi methods with the following equation system. On the plot graphic, there must be only 2 graphs (one for Gauss-Seidel and one for Jacobi) and each graphic should show the change of variable z over time.
3x -y +z = 15
x +4y -2z = -13
-3x +2y +6z = 11
Step by Step Solution
There are 3 Steps involved in it
Step: 1

Get Instant Access to Expert-Tailored Solutions
See step-by-step solutions with expert insights and AI powered tools for academic success
Step: 2

Step: 3
Ace Your Homework with AI
Get the answers you need in no time with our AI-driven, step-by-step assistance
Get Started
Filing And Computer Database Projects
Authors: Jeffrey Stewart
2nd Edition
007822781X, 9780078227813