Your write-up needs to address each the following area. Plainly label each section. Support your observations with numbers from your ratios or directional (horizontal & vertical) financial statements. For example, if long term debt increased, what caused it? Do you see an increase in property & equipment? Has the interest expense increase? Has depreciation jumped significantly?
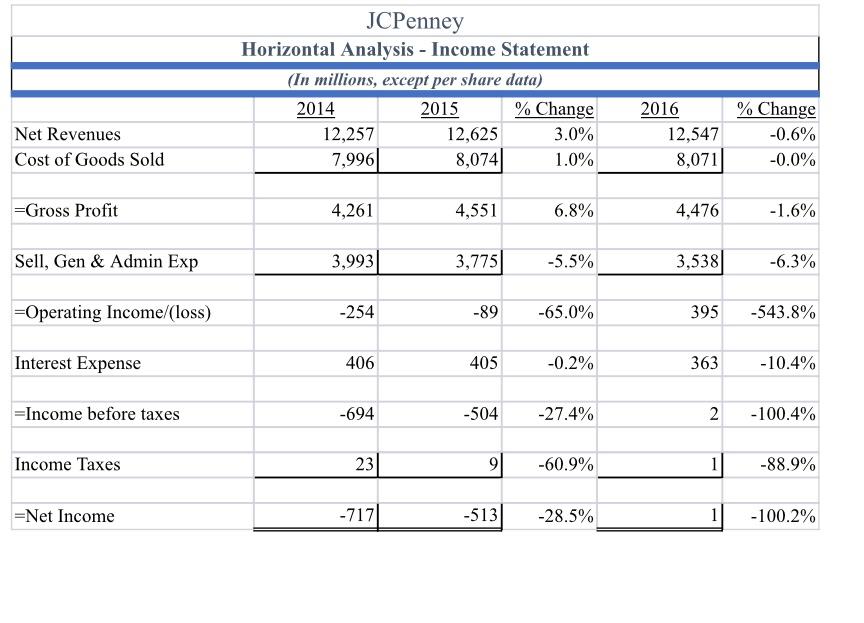
Sales Growth Are Net Sales Growing? Are there any divisions or product lines growing? Does the annual report give any indication about the reason(s) for this? Does your directional analysis (horizontal or vertical) bear this out? Can we see the sales increase in the inventory turnover ratio?
Cost Control are expenses in line with the change in net sales? Look at the levels of costs including cost of goods sold, marketing expenses, and administrative expenses. Look at the COGS% change and the SGA% (selling, general & administrative expenses) changes. Again, support your observation with your directional analysis and/or ratios.
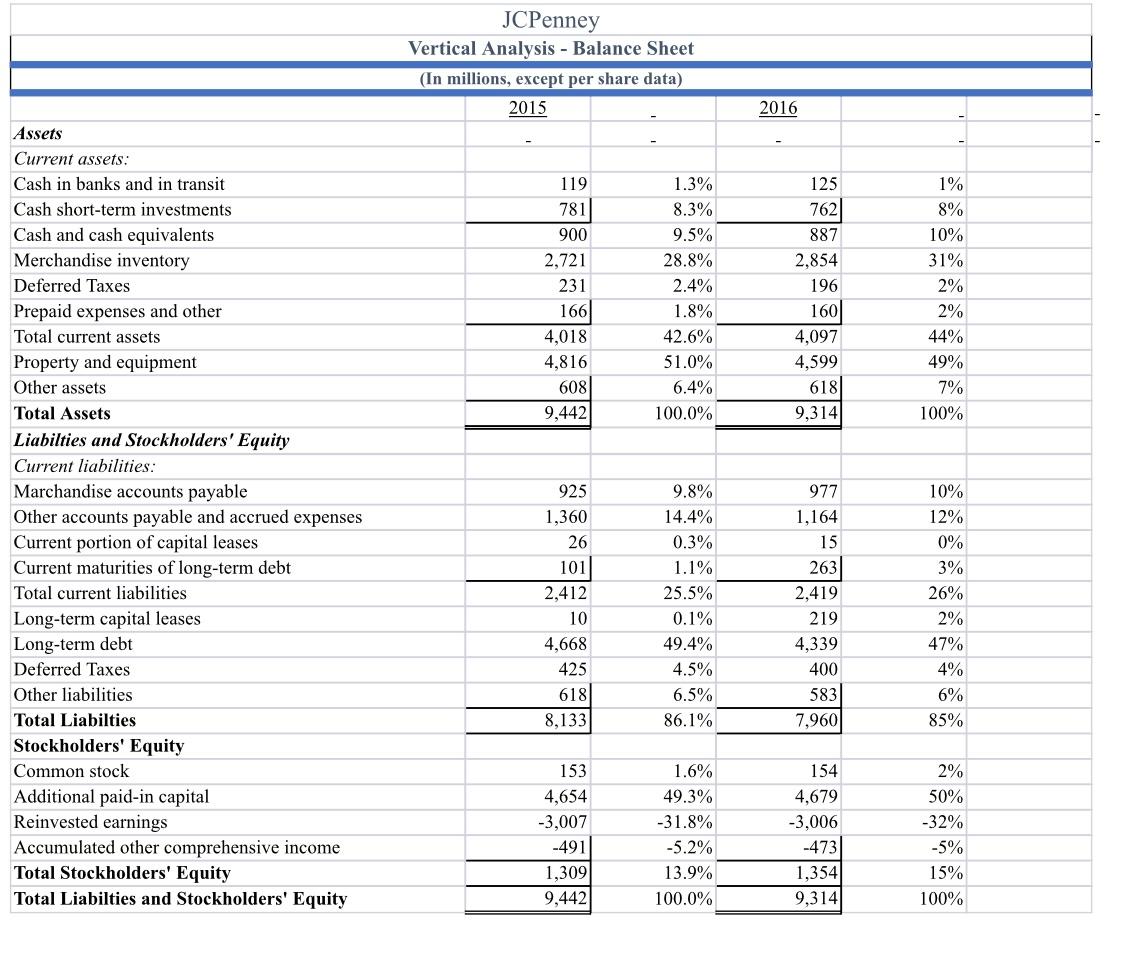
Profitability Look at the three levels of profits: gross margin, operating profit and net income. How are they changing from year to year as a percentage of sales (vertical analysis)?
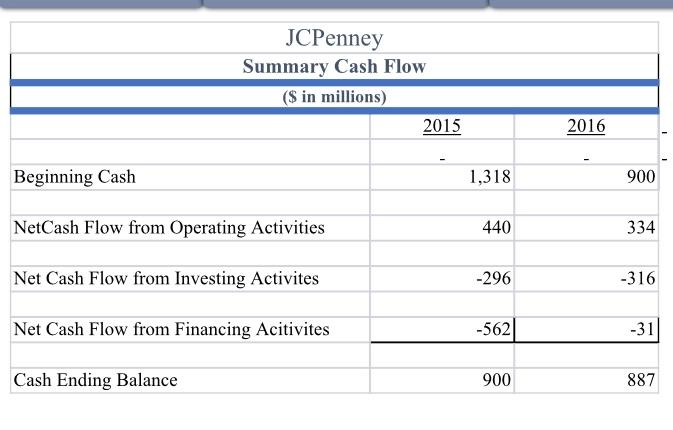
Cash Flow and Liquidity - Is cash increasing or decreasing. Does that make sense in light of the profits? What about the liquidity ratios? Did you find a change in the current or the quick ratio? Look at the cash flow statements. Is operations generating or consuming cash? Is the growth of inventory reasonable as compared to the growing of cost of goods sold? Look at the accounts payable turnover ratio. And dont forget about accounts receivable and its change. Are you concerned with changes in the accounts receivable turnover ratio?
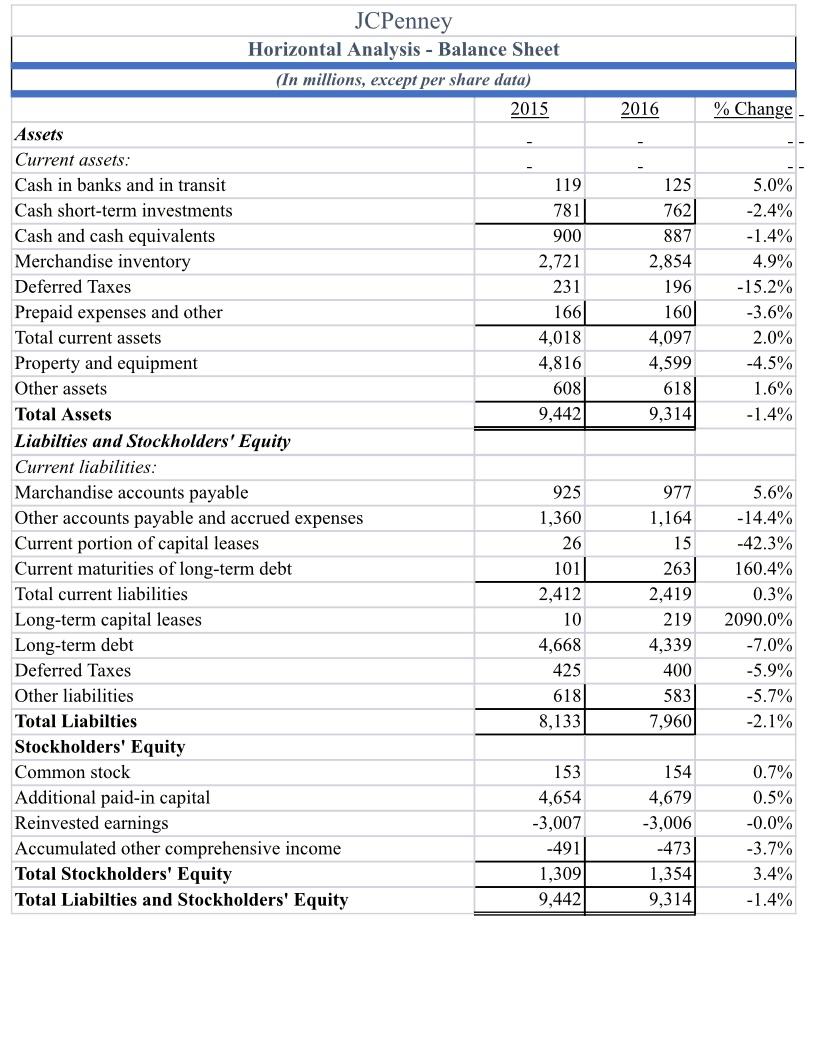
Debt Levels Is debt increasing or decreasing? Looks at the change in current and long-term liabilities in your directional analyses. What are the reasons for this change? Look at your debt ratios. Is there anything in annual report or outside articles to explain a significant change in debt, if you find one?
Equity and Stock Market Factors Has common stock plus the paid in capital on common stock increased? Has it decreased from a buyback of common stock (treasury stock)? What about the price of the stock, has it changed significant over the years of your analysis. Look at the price to earnings ratio and the dividend yield ratio.
Please follow the format above regarding the information below.
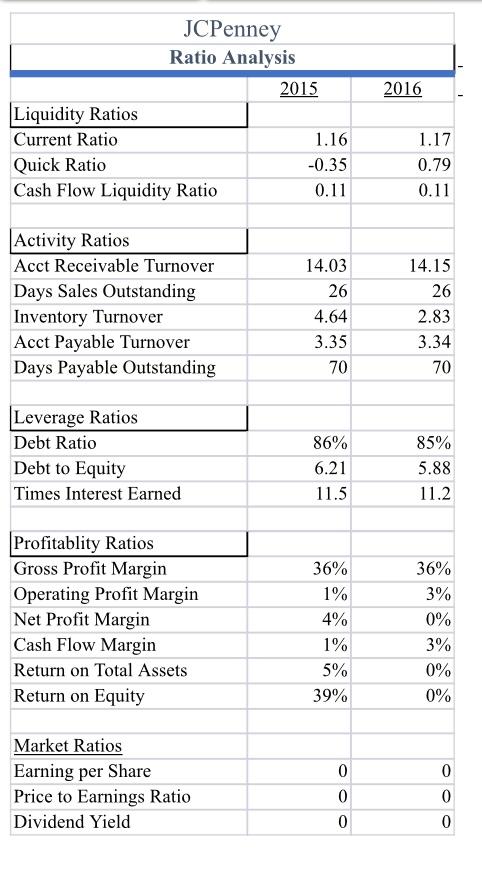
2016 % Change 119 5.0% -2.4% -1.4% 4.9% -15.2% 125 762 887 2,854 196 160 4,097 4,599 618) 9,314 -3.6% 2.0% -4.5% 1.6% -1.4% JCPenney Horizontal Analysis - Balance Sheet (In millions, except per share data) 2015 Assets Current assets: Cash in banks and in transit Cash short-term investments 781 Cash and cash equivalents 900 Merchandise inventory 2,721 Deferred Taxes 231 Prepaid expenses and other 166 Total current assets 4,018 Property and equipment 4,816 Other assets 608 Total Assets 9,442 Liabilties and Stockholders' Equity Current liabilities: Marchandise accounts payable Other accounts payable and accrued expenses 1,360 Current portion of capital leases 26 Current maturities of long-term debt 101 Total current liabilities 2,412 Long-term capital leases 10 Long-term debt 4,668 Deferred Taxes 425 Other liabilities 618 Total Liabilties 8,133 Stockholders' Equity Common stock 153 Additional paid-in capital 4,654 Reinvested earnings -3,007 Accumulated other comprehensive income -491 Total Stockholders' Equity 1,309 Total Liabilties and Stockholders' Equity 9,442 925 977 1,164 15 263 2,419 219 4,339 400 583 7,960 5.6% -14.4% -42.3% 160.4% 0.3% 2090.0% -7.0% -5.9% -5.7% -2.1% 154 4,679 -3,006 -473 1,354 9,314 0.7% 0.5% -0.0% -3.7% 3.4% -1.4% JCPenney Horizontal Analysis - Income Statement (In millions, except per share data) 2014 2015 % Change 12,257 12,625 3.0% 7,996 8,074 1.0% Net Revenues Cost of Goods Sold 2016 12,547 8,071 % Change -0.6% -0.0% =Gross Profit 4,261 4,551 6.8% 4,476 -1.6% Sell, Gen & Admin Exp 3,993 3,775 -5.5% 3,538 -6.3% =Operating Income/loss) -254 -89 -65.0% 395 -543.8% Interest Expense 406 405 -0.2% 363 -10.4% =Income before taxes -694 -504 -27.4% 2 -100.4% Income Taxes 23 9 -60.9% 1 -88.9% =Net Income -717 -513 -28.5% 1 -100.2% JCPenney Summary Cash Flow ($ in millions) 2015 2016 Beginning Cash 1,318 900 NetCash Flow from Operating Activities 440 334 Net Cash Flow from Investing Activites -296 -316 Net Cash Flow from Financing Acitivites -562 -31 Cash Ending Balance 900 887 JCPenney Vertical Analysis - Balance Sheet (In millions, except per share data) 2015 2016 125 762 119 781 900 2,721 231 166 4,018 4,816 608 9,442 1.3% 8.3% 9.5% 28.8% 2.4% 1.8% 42.6% 51.0% 6.4% 100.0% 887 2,854 196 160 4,097 4,599 618 9,314 1% 8% 10% 31% 2% 2% 44% 49% 7% 100% Assets Current assets: Cash in banks and in transit Cash short-term investments Cash and cash equivalents Merchandise inventory Deferred Taxes Prepaid expenses and other Total current assets Property and equipment Other assets Total Assets Liabilties and Stockholders' Equity Current liabilities: Marchandise accounts payable Other accounts payable and accrued expenses Current portion of capital leases Current maturities of long-term debt Total current liabilities Long-term capital leases Long-term debt Deferred Taxes Other liabilities Total Liabilties Stockholders' Equity Common stock Additional paid-in capital Reinvested earnings Accumulated other comprehensive income Total Stockholders' Equity Total Liabilties and Stockholders' Equity 925 1,360 26 101 2,412 9.8% 14.4% 0.3% 1.1% 25.5% 0.1% 49.4% 4.5% 6.5% 86.1% 977 1,164 15 263 2,419 219 4,339 10% 12% 0% 3% 26% 2% 10 4,668 47% 400 425 618 8,133 583 7,960 4% 6% 85% 153 4,654 -3,007 -491 1,309 9,442 1.6% 49.3% -31.8% -5.2% 13.9% 100.0% 154 4,679 -3,006 -473 1,354 9,314 2% 50% -32% -5% 15% 100% 2016 JCPenney Ratio Analysis 2015 Liquidity Ratios Current Ratio 1.16 Quick Ratio -0.35 Cash Flow Liquidity Ratio 0.11 1.17 0.79 0.11 Activity Ratios Acct Receivable Turnover Days Sales Outstanding Inventory Turnover Acct Payable Turnover Days Payable Outstanding 14.03 26 4.64 3.35 70 14.15 26 2.83 3.34 70 Leverage Ratios Debt Ratio Debt to Equity Times Interest Earned 86% 6.21 11.5 85% 5.88 11.2 Profitablity Ratios Gross Profit Margin Operating Profit Margin Net Profit Margin Cash Flow Margin Return on Total Assets Return on Equity 36% 1% 4% 1% 5% 39% 36% 3% 0% 3% 0% 0% Market Ratios Earning per Share Price to Earnings Ratio Dividend Yield 0 0 0 0 0 0


