

Compare the models that you have found in Problems 10.17, 10.18, and 10.19 by calculating the confidence
Question:
Compare the models that you have found in Problems 10.17, 10.18, and 10.19 by calculating the confidence intervals on the mean of the response PITCH for all points in the original data set. Based on a comparison of these confidence intervals, which model would you prefer? Now calculate the PRESS statistic for these models. Which model would PRESS indicate is likely to be the best for predicting new observations on PITCH?
Data From Problem 10.17
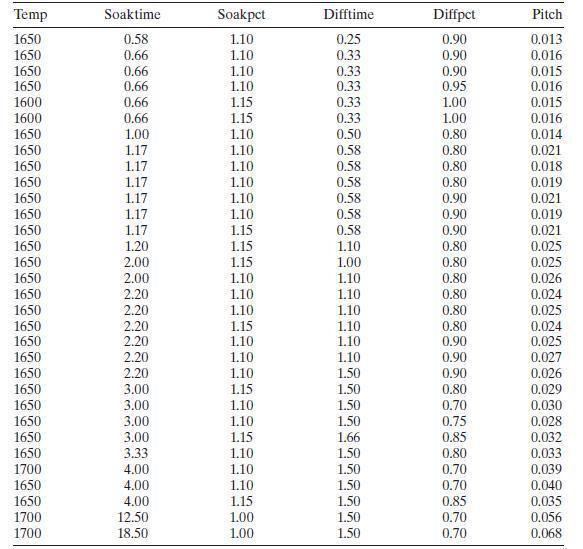
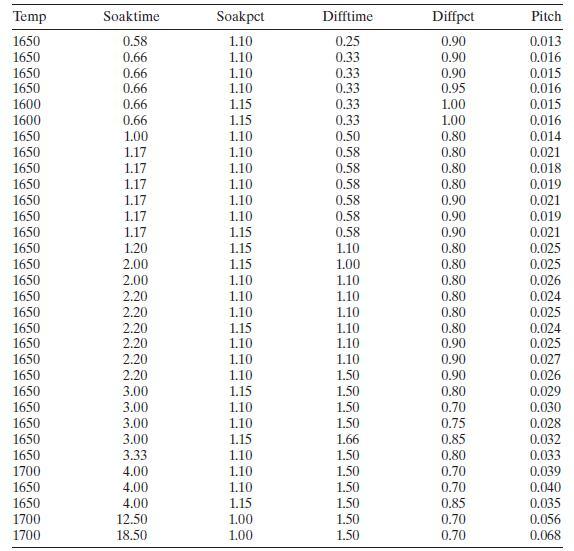
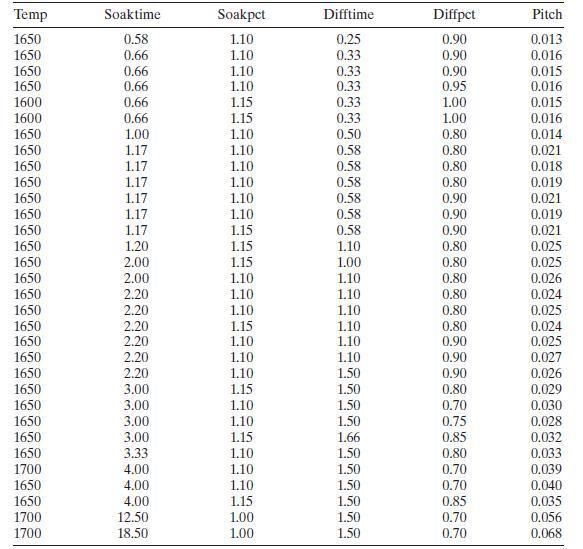
Table B. 12 presents data on a heat treating process used to carburize gears. The thickness of the carburized layer is a critical factor in overall reliability of this component. The response variable y=y=y= PITCH is the result of a carbon analysis on the gear pitch for a cross-sectioned part. Use all possible regressions and the CpCpCp criterion to find an appropriate regression model for these data. Investigate model adequacy using residual plots.

Data From Problem 10.18
Reconsider the heat treating data from Table B.12. Fit a model to the PITCH response using the variables
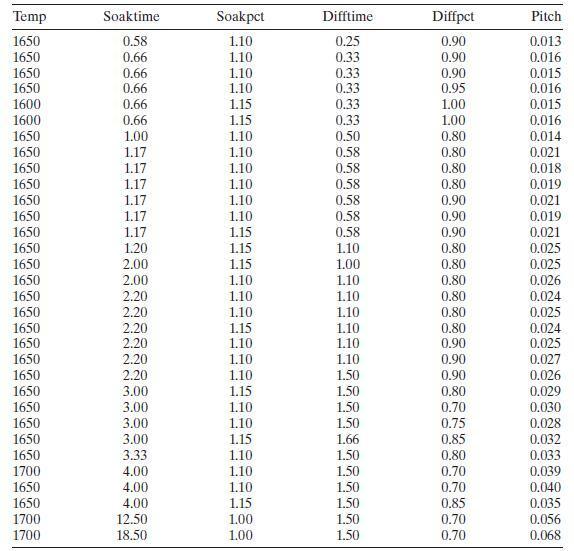
x1=SOAKTIME×SOAKPCT and x2= DIFFTIME × DIFFPCT x1=SOAKTIME×SOAKPCT and x2= DIFFTIME × DIFFPCT
as regressors. How does this model compare to the one you found by the all-possible-regressions approach of Problem 10.17?
Problem 10.17
Table B. 12 presents data on a heat treating process used to carburize gears. The thickness of the carburized layer is a critical factor in overall reliability of this component. The response variable y=y=y= PITCH is the result of a carbon analysis on the gear pitch for a cross-sectioned part. Use all possible regressions and the CpCpCp criterion to find an appropriate regression model for these data. Investigate model adequacy using residual plots.
Data Form Problem 10.19
Repeat Problem 10.17 using the two cross-product variables defined in Problem 10.18 as additional candidate regressors. Comment on the model that you find.
Data From Problem 10.17
Table B. 12 presents data on a heat treating process used to carburize gears. The thickness of the carburized layer is a critical factor in overall reliability of this component. The response variable y=y= PITCH is the result of a carbon analysis on the gear pitch for a cross-sectioned part. Use all possible regressions and the CpCp criterion to find an appropriate regression model for these data. Investigate model adequacy using residual plots.

Data From Problem 18
Reconsider the heat treating data from Table B.12. Fit a model to the PITCH response using the variables
x1=SOAKTIME×SOAKPCT and x2= DIFFTIME × DIFFPCT
as regressors. How does this model compare to the one you found by the all-possible-regressions approach of Problem 10.17?
Problem 10.17
Table B. 12 presents data on a heat treating process used to carburize gears. The thickness of the carburized layer is a critical factor in overall reliability of this component. The response variable y=y= PITCH is the result of a carbon analysis on the gear pitch for a cross-sectioned part. Use all possible regressions and the CpCp criterion to find an appropriate regression model for these data. Investigate model adequacy using residual plots.
Step by Step Answer:


Introduction To Linear Regression Analysis
ISBN: 9781119578727
6th Edition
Authors: Douglas C. Montgomery, Elizabeth A. Peck, G. Geoffrey Vining
