

Question: The table below contains conductivity data for a crystal of NaCl. Comment on the shape of a plot of ln(T) versus 1/T. Estimate the activation
The table below contains conductivity data for a crystal of NaCl. Comment on the shape of a plot of ln(σT) versus 1/T. Estimate the activation energy for vacancy migration and Schottky defect formation from your graph.
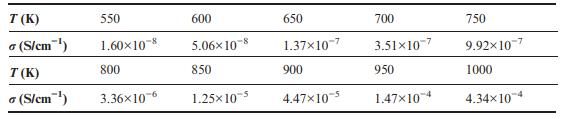
T (K) (S/cm-) T(K) (S/cm-) 550 1.6010 % 800 3.36x10⁻⁶ 600 5.06x10⁻⁸ 850 1.25x10⁻⁵ 650 1.37x1077 900 4.47x10⁻⁵ 700 3.511077 950 1.47x10⁴ 750 9.9210-7 1000 4.3410 4
Step by Step Solution
★★★★★
3.35 Rating (155 Votes )
There are 3 Steps involved in it
1 Expert Approved Answer
Step: 1 Unlock

The data should give essentially the plot in Figure 135 ... View full answer
Question Has Been Solved by an Expert!
Get step-by-step solutions from verified subject matter experts
Step: 2 Unlock
Step: 3 Unlock