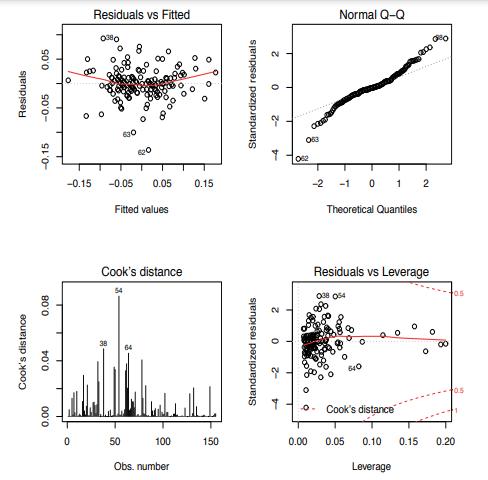
A q-q plot of regression residuals, as in Figure 4.13, is often a part of regression analysis.
Question:
A q-q plot of regression residuals, as in Figure 4.13, is often a part of regression analysis.
Why might a q-q plot of the residuals be of interest?
What kind of regression residuals should be used in a q-q plot? Why?
Figure 4.13:

Step by Step Answer:
Related Book For 

Question Posted:


