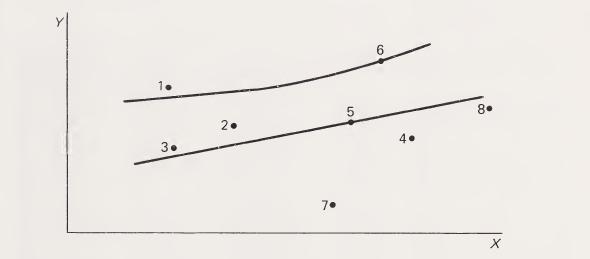
The graph below is a 97.5% confidence interval for a regression analysis. Eight data sets were used
Question:
The graph below is a 97.5% confidence interval for a regression analysis.
Eight data sets were used for the calculations. The following questions refer to the graph.

a. The two variables being used in the regression are monthly repairs and maintenance expense and monthly total factory machine hours. Label each axis. Explain why you labeled them as you did.
b. Identify the line on the graph that is defined by Y = a + bX.
c. Identify the amount of monthly fixed repair and maintenance expense that can be expected.
d. Does the graph show a one-sided or two-sided confidence interval?
e. Identify all data points (1-8) on the graph that are outliers.
f. Regraph the confidence interval using a two-sided interval at a 90% confidence level.
g. Using the confidence interval in
f, which data points are outliers?
h. Which data point (1-8) shows the expected value of repairs and maintenance at a particular number of machine hours? Explain your answer.
i. Regraph the straight line and confidence interval assuming that there was an error in the original calculation. The correct straight line has a slightly smaller fixed element and greater slope.
Step by Step Answer:

Applications Of Statistical Sampling To Auditing
ISBN: 9780130391568
1st Edition
Authors: Alvin A. Arens, James K. Loebbecke


