

10.51 Social activities for students As part of her class project, a student at the University of...
Question:
10.51 Social activities for students As part of her class project, a student at the University of Florida randomly sampled 10 fellow students to investigate their most common social activities.
As part of the study, she asked the students to state how many times they had done each of the following activities during the previous year: going to a movie, going to a sporting event, or going to a party. The table shows the data.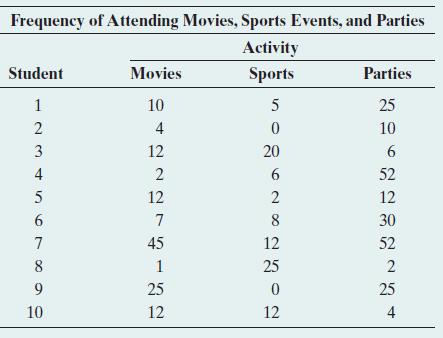
a. To compare the mean movie attendance and mean sports attendance using statistical inference, should we treat the samples as independent or dependent? Why?
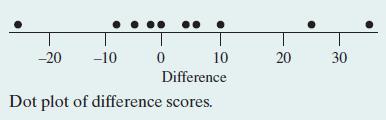
b. The figure is a dot plot of the n = 10 difference scores for movies and sports. Does this show any irregularities that would make statistical inference unreliable?
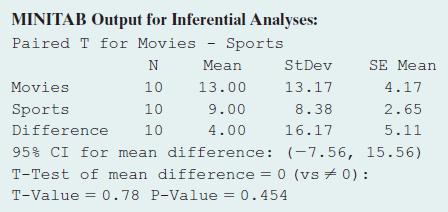
c. Using the MINITAB output shown for these data, show how the 95% confidence interval was obtained from the other information given in the printout.
Interpret the interval.
d. Show how the test statistic shown on the printout was obtained from the other information given. Report the P-value and interpret in context.
Step by Step Answer:

This question has not been answered yet.
You can Ask your question!


Statistics The Art And Science Of Learning From Data
ISBN: 9781292164878
4th Global Edition
Authors: Alan Agresti, Christine A. Franklin, Bernhard Klingenberg
