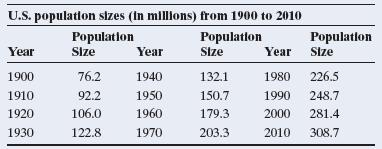
12.57 U.S. population growth The table shows the approximate U.S. population size (in millions) at 10-year intervals
Question:
12.57 U.S. population growth The table shows the approximate U.S. population size (in millions) at 10-year intervals beginning in 1900. Let x denote the number of decades since 1900. That is, 1900 is x = 0, 1910 is x = 1, and so forth. The exponential regression model fitted to y = population size and x gives yn = 81.14 * 1.1339x.

a. Show that the predicted population sizes are 81.14 million in 1900 and 323.3 million in 2010.
b. Explain how to interpret the value 1.1339 in the prediction equation.
c. The correlation equals 0.98 between the log of the population size and the year number. What does this suggest about whether the exponential regression model is appropriate for these data?
Step by Step Answer:

Statistics The Art And Science Of Learning From Data
ISBN: 9781292164878
4th Global Edition
Authors: Alan Agresti, Christine A. Franklin, Bernhard Klingenberg


