

7.10 Effect of n on sample proportion The figure illustrates two sampling distributions for sample proportions when the population proportion p = 0.50. a. Find
7.10 Effect of n on sample proportion The figure illustrates two sampling distributions for sample proportions when the population proportion p = 0.50.
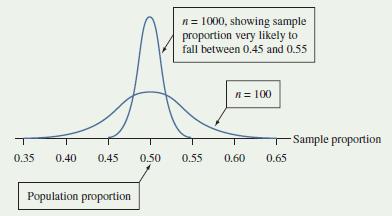
a. Find the standard deviation for the sampling distribution of the sample proportion with (i) n = 100 and (ii) n = 1000.
b. Explain why the sample proportion would be very likely (as the figure suggests) to fall (i) between 0.35 and 0.65 when n = 100, and (ii) between 0.45 and 0.55 when n = 1000. (Hint: Recall that for an approximately normal distribution, nearly the entire distribution is within 3 standard deviations of the mean.)
c. Explain how the results in part b indicate that the sample proportion tends to estimate the population proportion more precisely when the sample size is larger.
n = 1000, showing sample proportion very likely to fall between 0.45 and 0.55 n = 100 T -Sample proportion 0.35 0.40 0.45 0.50 0.55 0.60 0.65 Population proportion
Step by Step Solution
There are 3 Steps involved in it
Step: 1

Get step-by-step solutions from verified subject matter experts
100% Satisfaction Guaranteed-or Get a Refund!
Step: 2Unlock detailed examples and clear explanations to master concepts

Step: 3Unlock to practice, ask and learn with real-world examples
See step-by-step solutions with expert insights and AI powered tools for academic success
-
 Access 30 Million+ textbook solutions.
-
Ask unlimited questions from AI Tutors.
-
Order free textbooks.
-
100% Satisfaction Guaranteed-or Get a Refund!
Claim Your Hoodie Now!

Authors: Alan Agresti, Christine A. Franklin, Bernhard Klingenberg
4th Global Edition
1292164875, 9781292164878

Study Smart with AI Flashcards
Access a vast library of flashcards, create your own, and experience a game-changing transformation in how you learn and retain knowledge
Explore Flashcards

