

Refer to Table 12.1, in which the relationship between x5mathematics achievement test score and y5final calculus grade
Question:
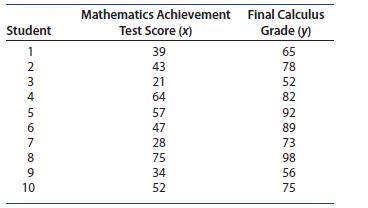
Refer to Table 12.1, in which the relationship between x5mathematics achievement test score and y5final calculus grade was studied.
1. Enter the data from columns 2 and 3 into L1 and L2 and choose stat ➤ TESTS ➤
F:LinRegTTest (choice E on the TI-83). The screen in Figure 12.22
(a) will appear.
Select or type L1 for the Xlist and L2 for the Ylist. Select the appropriate alternative for testing H : 0 0 b 5 (or its equivalent, H : 0 0 r 5 ).
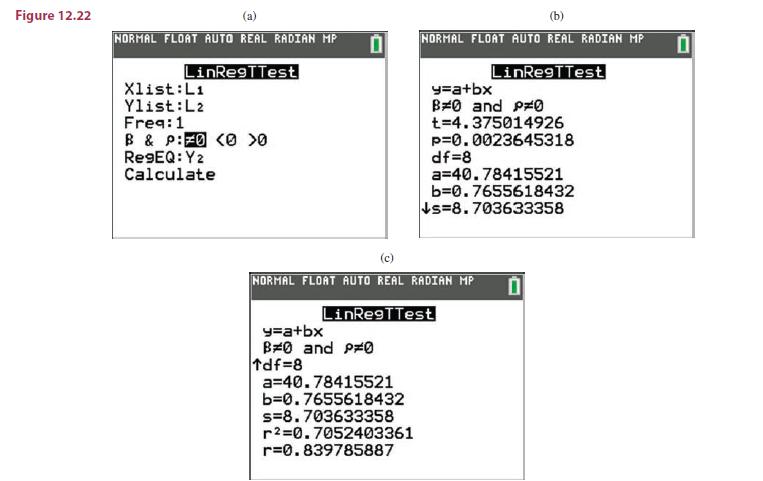
2. If you want to plot the regression line, you can use the procedures discussed in Chapter 3 or you can designate a storage location using the RegEQ: line on this screen. Move the cursor to Calculate and press enter to see the results in Figures 12.22
(b) and 12.22(c).
3. Figures 12.22
(b) and 12.22
(c) are actually the same screen, but you will need to scroll down to see the last two entries, r2 and r. Notice that the value of the test statistic, t54.38 is identical to the values calculated by hand in Example 12.2 and also found in Figure 12.7.
Step by Step Answer:

This question has not been answered yet.
You can Ask your question!


Introduction To Probability And Statistics
ISBN: 9780357114469
15th Edition
Authors: William Mendenhall Iii , Robert Beaver , Barbara Beaver
