

Refer to Table 12.1, in which the relationship between x5mathematics achievement test score and y5final calculus grade
Question:
Refer to Table 12.1, in which the relationship between x5mathematics achievement test score and y5final calculus grade was studied.\
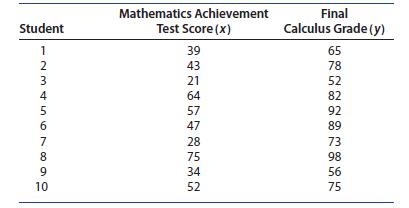
Enter the values for x and y into the first two columns of a MINITAB worksheet.
1. The main tools for linear regression analysis are generated using Stat ➤ Regression ➤
Regression ➤ Fit Regression Model. (You will use this same sequence of commands in Chapter 13 when you study multiple regression analysis.) The Dialog box for the Regression command is shown in Figure 12.19(a).
2. Select y in the “Responses:” box and x in the “Continuous Predictors” box. Use the Results option to determine the content of the regression printout, and make sure that “Basic Tables” is selected in the top drop-down list. By unclicking any of the boxes in Figure 12.19
(b) you will delete that part of the output on the printout. Click OK to return to the main Dialog box.
3. You can now generate some residual plots to check the validity of your regression assumptions before using the model for estimation or prediction. Choose Graphs to display the Dialog box in Figure 12.19(c). We have selected Regular in the box “Residuals for plots” and checked the boxes for “Normal probability plot of residuals” and “Residuals versus fits.” Click OK to return to the main Dialog box and OK again to generate the regression printout given in Figure 12.19(d). The two diagnostic plots will appear in separate graphics windows.
Step by Step Answer:

This question has not been answered yet.
You can Ask your question!


Introduction To Probability And Statistics
ISBN: 9780357114469
15th Edition
Authors: William Mendenhall Iii , Robert Beaver , Barbara Beaver
