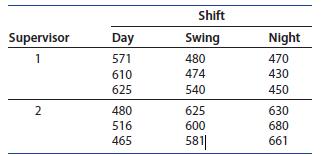
(Two-Way Classification) Refer to the production output study in Example 11.13, in which the effect of supervisor...
Question:
(Two-Way Classification) Refer to the production output study in Example 11.13, in which the effect of supervisor and shift on production output was studied

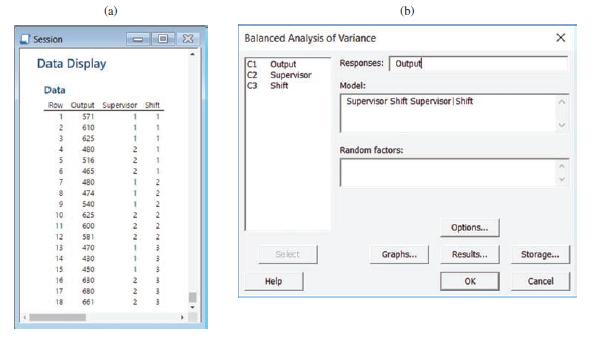
1. Enter the data into the worksheet as shown in Figure 11.21(a). See if you can use the Calc ➤ Make Patterned Data ➤ Simple Set of Numbers to enter the data in columns C2–C3.
2. Use Stat ➤ ANOVA ➤ Balanced ANOVA to generate the Dialog box in Figure 11.21(b). Choose “Output” for the “Responses” box, and “Supervisor,” “Shift,”
and “Supervisor|Shift” in the “Model” box.† You may choose to display the main effect means by selecting the “Results” option and choosing “Supervisor” and “Shift” in the box marked “Display means according to the terms,” and you may select residual plots if you wish using the “Graphs” option. Click OK to obtain the ANOVA printout shown in Figure 11.13(a).

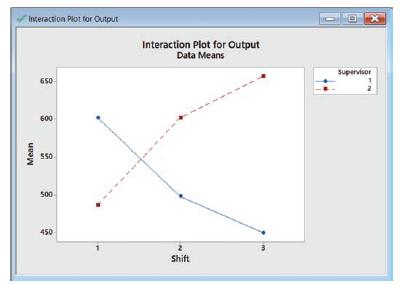
3. Since the interaction between supervisors and shifts is highly significant, you may want to explore the nature of this interaction by plotting the average output for each supervisor at each of the three shifts. Use Stat ➤ ANOVA ➤ Interaction Plot and choose the appropriate response and factor variables. The plot is shown in Figure 11.22. You can see the strong difference in the behaviors of the mean outputs for the two supervisors, indicating a strong interaction between the two factors.

Step by Step Answer:

Introduction To Probability And Statistics
ISBN: 9780357114469
15th Edition
Authors: William Mendenhall Iii , Robert Beaver , Barbara Beaver


