C5. The following output depicts data for population change in midwestern and western states between 2010 and
Question:
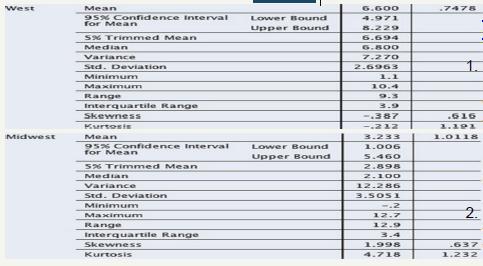
C5. The following output depicts data for population change in midwestern and western states between 2010 and 2016 from Table 4.4.

1. Compare the range for the western states with that of the Midwest. Which region had a greater range?
2. Examine the IQR for each region.
Which is greater?
3. Use the statistics to characterize the variability in population increase in the two regions. Does one region have more variability than another? If yes, why do you think that is?
Fantastic news! We've Found the answer you've been seeking!
Step by Step Answer:
Related Book For 

Social Statistics For A Diverse Society
ISBN: 9781544339733
9th Edition
Authors: Chava Frankfort Nachmias, Anna Y Leon Guerrero, Georgiann Davis
Question Posted:


