

Question: Cardiologists use the short-range scaling exponent 1, which measures the randomness of heart rate patterns, as a tool to assess risk of heart attack. The
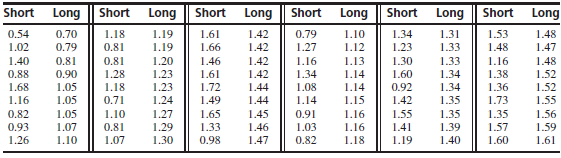
Cardiologists use the short-range scaling exponent α1, which measures the randomness of heart rate patterns, as a tool to assess risk of heart attack. The article ??Applying Fractal Analysis to Short Sets of Heart Rate Variability Data?? (M. Pe˜na et al., Med Biol Eng Comput, 2009:709??717) compared values of α1 computed from long series of measurements (approximately 40,000 heartbeats) with those estimated from the first 300 beats to determine how wellthe long-term measurement (y) could be predicted the short-term one (x). Following are the data (obtained by digitizing a graph).
a. Compute the least-squares line for predicting the long-term measurement from the short-term measurement.
b. Compute the error standard deviation estimate s.
c. Compute a 95% confidence interval for the slope.
d. Find a 95% confidence interval for the mean long-term measurement for those with short-term measurements of 1.2.
e. Can you conclude that the mean long-term measurement for those with short-term measurements of 1.2 is greater than 1.2? Perform a hypothesis test and report the P-value.
f. Find a 95% prediction interval for the long-term measurement for a particular individual whose short-term measurement is 1.2.
g. The purpose of a short-term measurement is to substitute for a long-term measurement. For this purpose, which do you think is more relevant, the confidence interval or the prediction interval? Explain.
Long || Short Long Long Short Short Long Short Long Short Short Long 0.54 1.02 0.70 1.18 1.19 1.61 1.42 0.79 1.10 1.34 1.31 1.53 1.48 0.79 0.81 1.19 1.66 1.42 1.27 1.12 1.23 1.33 1.48 1.47 1.33 1.34 1.40 0.81 0.81 1.20 1.46 1.42 1.16 1.13 1.30 1.16 1.48 0.88 0.90 1.28 1.23 1.61 1.42 1.34 1.14 1.60 1.38 1.52 1.05 1.05 1.05 1.23 1.24 1.68 1.18 1.72 1.44 1.08 1.14 0.92 1.34 1.36 1.52 1.16 0.71 1.49 1.44 1.14 1.15 1.42 1.35 1.73 1.55 0.82 1.10 1.27 1.65 1.45 0.91 1.16 1.55 1.35 1.35 1.56 0.93 1.07 0.81 1.29 1.33 1.46 1.03 1.16 1.41 1.39 1.57 1.59 1.26 1.10 1.07 1.30 0.98 1.47 0.82 1.18 1.19 1.40 1.60 1.61
Step by Step Solution
3.42 Rating (168 Votes )
There are 3 Steps involved in it
a The leastsquares line is y 0780949 0398574x b c There are n 2 52 degrees of freedom t 52 025 20066 ... View full answer

Get step-by-step solutions from verified subject matter experts