

Question: The figure below is a histogram showing the distribution of serum cholesterol level for a sample of men. Use the histogram to answer the following
The figure below is a histogram showing the distribution of serum cholesterol level for a sample of men. Use the histogram to answer the following questions:
a. Is the percentage of men with cholesterol levels above 240 mg/dL closest to 30%, 50%, or 70%?
b. In which interval are there more men: 240€“260 mg/dL or 280€“340 mg/dL?
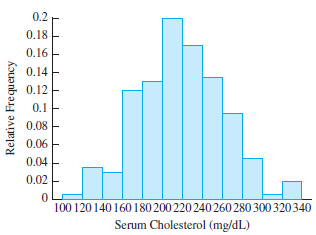
0.2 0.18 0.16 - 0.14 0.12 0.1 0.08 0.06 0.04 0.02 100 120140 160 180 200 220240 260280 300 320340 Serum Cholesterol (mg/dL) Relative Frequency
Step by Step Solution
3.42 Rating (155 Votes )
There are 3 Steps involved in it
a The proportion is the sum of the relative frequencies heights of the ... View full answer

Get step-by-step solutions from verified subject matter experts