

The figure below is a histogram showing the distribution of blood pressure for all 14,148 women in
Question:
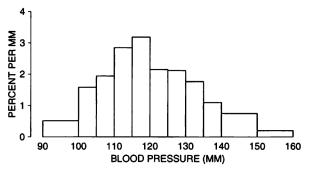
The figure below is a histogram showing the distribution of blood pressure for all 14,148 women in the Drug Study (section 5). Use the histogram to answer the following questions:
(a) Is the percentage of women with blood pressures above 130 mm around 25%, 50%, or 75%?
(b) Is the percentage of women with blood pressures between 90 mm and 160 mm around 1%, 50%, or 99%?
(c) In which interval are there more women: 135-140 mm or 140-150 mm? P-968
Fantastic news! We've Found the answer you've been seeking!
Step by Step Answer:

Answered By
Benard Ndini Mwendwa
I am a graduate from Kenya. I managed to score one of the highest levels in my BS. I have experience in academic writing since I have been working as a freelancer in most of my time. I am willing to help other students attain better grades in their academic portfolio. Thank you.
107+ Reviews
240+ Question Solved
Related Book For 
Question Posted:
