

Question: This exercise continues the study of the robustness of the Students t method for constructing confidence intervals. The following figure shows graphs of probability density
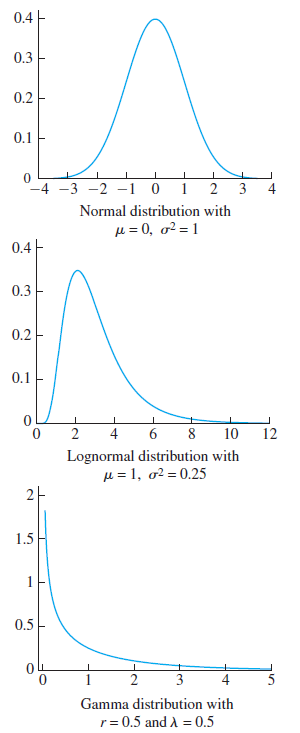
This exercise continues the study of the robustness of the Student€™s t method for constructing confidence intervals. The following figure shows graphs of probability density functions for the N(0, 1) distribution, the lognormal distribution with μ = 1 and σ2= 0.25, and the gamma distribution with r = 0.5 and λ = 0.5 (this is also known as the chi-square distribution with one degree of freedom). For each of these distributions, generate 10,000 samples of size 5, and for each sample compute the upper and lower limits of a 95% confidence interval using the Student€™s t method. [If necessary, it is possible to compute the lognormal and gamma random values from normal random values. Specifically, to compute a value X from a lognormal distribution with μ = 1 and σ2= 0.25, generate Y ˆ¼ N(1, 0.25) and compute X = eY. To generate a value X from a gamma distribution with r = 0.5 and λ = 0.5, generate Y ˆ¼ N(0, 1) and compute X = Y2.]
a. The true mean of the N(0, 1) distribution is 0. Based on the simulation results, estimate the coverage probability (proportion of samples for which the confidence interval covers the true mean) for samples of size 5 from the N(0, 1) distribution. (Since the assumptions underlying the Student€™s t method are satisfied here, your answer should be very close to 95%.)
b. The true mean of the lognormal distribution with μ = 1 and σ2 = 0.25 is 3.0802. Based on the simulation results, estimate the coverage probability (proportion of samples for which the confidence interval covers the true mean) for samples of size 5 from the lognormal distribution with μ = 1 and σ2 = 0.25.
c. The true mean of the gamma distribution with r = 0.5 and λ = 0.5 is 1. Based on the simulation results, estimate the coverage probability (proportion of samples for which the confidence interval covers the true mean) for samples of size 5 from the gamma distribution with r = 0.5 and λ = 0.5.
0.4 - 0.3 0.2 0.1 -4 -3 -2 -1 0 3 Normal distribution with = 0, g = 1 0.4- 0.3 0.2- 0.1 4 6. 10 12 Lognormal distribution with = 1, o2 = 0.25 2- 1.5 0.5- 3 Gamma distribution with r= 0.5 and A = 0.5
Step by Step Solution
3.40 Rating (162 Votes )
There are 3 Steps involved in it
a 95 exactly ... View full answer

Get step-by-step solutions from verified subject matter experts