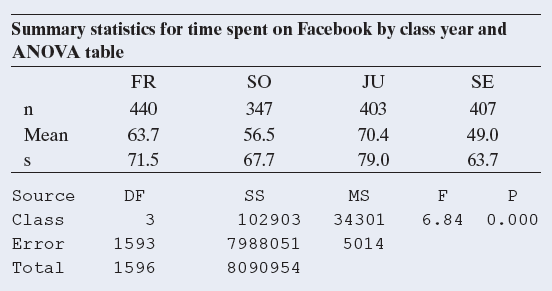
Refer to Exercise 14.13, which investigated the amount of time freshman, sophomores, juniors, and seniors spent on
Question:
a. If you want to construct confidence intervals between all possible pairs of means for the four classes, how many intervals do you need to construct?
b. Using software (such as the web app ANOVA accessible from the book€™s website), find the confidence intervals for all possible pairs of population means such that the overall error rate of all intervals is 0.05 (use Tukey€™s method). Visualize the confidence intervals in a figure similar to Figure 14.4. (The web app can construct such a plot, which you can download.)
c. Is it true that seniors spent significantly less time than all other classes? Explain.
Exercise 14.13
Do freshmen spent significantly more time on Facebook than other class ranks? A recent study (R. Junco, Journal of Applied Developmental
Psychology, 2015, vol. 36, p. 18€“29) investigated the amount of time per day freshman, sophomores, juniors, and seniors spent on Facebook while doing schoolwork. The students surveyed were U.S. residents from a 4-year, public, primarily residential institution in the Northeastern United States. The data from the survey are available on the book€™s website, with time measured in minutes. The following computer output shows the mean time each cohort spent on Facebook and an ANOVA table. Construct a 95% confidence interval to compare the population mean time spent per day on Facebook between freshmen and seniors.

Step by Step Answer:

Statistics The Art And Science Of Learning From Data
ISBN: 9780321997838
4th Edition
Authors: Alan Agresti, Christine A. Franklin, Bernhard Klingenberg


