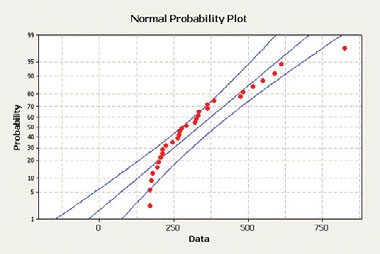
In Problem, a normal probability plot of a simple random sample of data from a population whose
Question:
In Problem, a normal probability plot of a simple random sample of data from a population whose distribution is unknown was obtained. Given the normal probability plot, is there reason to believe the population is normally distributed? 
The word "distribution" has several meanings in the financial world, most of them pertaining to the payment of assets from a fund, account, or individual security to an investor or beneficiary. Retirement account distributions are among the most...
Transcribed Image Text:
Normal Probability Plot 70 20 10 250 S00 750 Data Probability
Fantastic news! We've Found the answer you've been seeking!
Step by Step Answer:
Answer rating: 72% (11 reviews)
The plotted points do not app...View the full answer

Answered By

Saikumar Ramagiri
Financial accounting:- Journal and ledgers, preparation of trail balance and adjusted trail balance Preparation of income statement, retained earning statement and balance sheet Banks reconciliation statements Financial statement analysis Cash flow statement analysis (both direct and indirect methods) All methods of Depreciations Management Accounting:- Ratios Budgeting control Cash budget and production budget Working capital management Receivable management Costing:- Standard and variance costing Marginal costing and decision making Cost-volume-profit analysis Inventory management (LIFO, FIFO) Preparation and estimation of cost sheet Portfolio management:- Calculation of portfolio standard deviation or risk Calculation of portfolio expected returns CAPM, Beta Financial management:- Time value of money Capital budgeting Cost of capital Leverage analysis and capital structure policies Dividend policy Bond value calculations like YTM, current yield etc International finance:- Derivatives Futures and options Swaps and forwards Business problems Finance problems Education (mention all your degrees, year awarded, Institute/University, field(s) of major): Education Qualification Board/Institution/ University Month/Year of Passing % Secured OPTIONALS/ Major ICWAI(inter) ICWAI inter Pursuing Pursuing - M.com(Finance) Osmania University June 2007 65 Finance & Taxation M B A (Finance) Osmania University Dec 2004 66 Finance & Marketing. B.Com Osmania University June 2002 72 Income Tax, Cost & Mgt, Accountancy, Auditing. Intermediate (XII) Board of Intermediate May 1999 58 Mathematics, Accountancy, Economics. S S C (X) S S C Board. May 1997 74 Mathematics, Social Studies, Science. Tutoring experience: • 10 year experience in online trouble shooting problems related to finance/accountancy. • Since 6 Years working with solution inn as a tutor, I have solved thousands of questions, quick and accuracy Skills (optional): Technical Exposure: MS Office, SQL, Tally, Wings, Focus, Programming with C Financial : Portfolio/Financial Management, Ratio Analysis, Capital Budgeting Stock Valuation & Dividend Policy, Bond Valuations Individual Skills : Proactive Nature, Self Motivative, Clear thought process, Quick problem solving skills, flexible to complex situations. Achievements : 1. I have received an Award certificate from Local Area MLA for the cause of getting 100% marks in Accountancy during my Graduation. 2. I have received a GOLD MEDAL/Scholarship from Home Minister in my MBA for being the “Top Rank student “ of management institute. 3. I received numerous complements and extra pay from various students for trouble shooting their online problems. Other interests/Hobbies (optional): ? Web Surfing ? Sports ? Watching Comics, News channels ? Miniature Collection ? Exploring hidden facts ? Solving riddles and puzzles
4.80+
391+ Reviews
552+ Question Solved
Related Book For 

Statistics Informed Decisions Using Data
ISBN: 9780321757272
4th Edition
Authors: Michael Sullivan III
Question Posted:
Students also viewed these Mathematics questions
-
A normal probability plot of the n = 26 observations on escape time given in Exercise 36 of Chapter 1 shows a substantial linear pattern; the sample mean and sample standard deviation are 370.69 and...
-
Data set: Games1 a. Create a normal probability plot and histogram of the residuals from the Games1 data (Question 26) and comment on the normality assumption for the random error term. b. Create a...
-
A normal probability plot can be constructed using MINITAB. Use the selections Stat: Basic Statistics Normality test, and select the data to be analyzed. Although the MINITAB plot is slightly...
-
Marks 1. Find the limits, if they exist. If a limit does not exist, check whether the function approaches +00 x2 + 2x - 15 (5) (a) lim x-3 x2-4x +3 x2 - 4 (5) (b) lim x2 x4 - 16 Carol Ferland CF...
-
Fill in the details about the distribution of d left out of the proof of Theorem 11.3.3. (a) Show that the estimator = - can be expressed as where (b) Verify that (c) Verify that rL nSr: il Cov(a , )...
-
A desk is reported to weigh 185 pounds. What is the assumed uncertainty in this weight?
-
Jorge Company bottles and distributes B-Lite, a diet soft drink. The beverage is sold for 50 cents per 16-ounce bottle to retailers. For the year 2020, management estimates the following revenues and...
-
A partially completed pension spreadsheet showing the relationships among the elements that comprise the defined benefit pension plan of Universal Products is given below. The actuary's discount rate...
-
Case 9 - 2 7 ( Algo ) Master Budget with Supporting Schedules [ LO 2 ] The following data relate to the operations of Shilow Company, a wholesale distributor of consumer goods: a . The gross margin...
-
The blocks A and B weigh 10 and 30 lb, respectively. They are connected together by a light cord and ride in the frictionless grooves. Determine the speed of each block after block A moves 6 ft up...
-
Find the value of z 0.04 .
-
Where does the qualified business income (QBI) deduction fit into the individual income tax formula and what type of deduction is it?
-
Rework Example 11.6 for half-cosine pulses given by kt Pr(t) = II [t kt (t kt cos |T k = 0,1,2,K
-
Please help. I would really appreciate it. Question 1. Polly owns an electric power plant in the city of Newtown. The market price of electricity in Newtown is $1.00 per kilowatt hour (kwh). Polly's...
-
(Appendix 3A) Jenson Manufacturing is developing cost formula for future planning and cost control. Utilities is one of the mixed costs associated with production. The cost analyst has suggested that...
-
A company has the following trial balance as at 31 December 2015: TRIAL BALANCE AS AT 31 DEC 2015 Dr Cr Sales Revenue 125 000 Purchases 78 000 Carriage 4 000 Electricity and rent 5 100 Administrative...
-
What gets printed to the screen by the following segment of code? String str1 = "hello"; String str2 = "world"; if (!strl.equals(str2)) { System.out.println(str1+" "+str2); } else { }...
-
a) Consider the following financial data (in millions of dollars) for Costello Laboratories over the period of 2014-2018: Year Sales Net income Total assets Common equity 2014 $3,800 $500 $3,900...
-
Use the data in Exercise 6-3 to compute gross profit for the month of January for Laker Company similar to that in Exhibit 6.8 for the four inventory methods. 1. Which method yields the highest gross...
-
Read Case Study Google: Dont Be Evil Unless and answer the following: Why do you think Google was adamant about not wanting to supply information requested by the government concerning the Child...
-
The following data represent the percentage of total federal debt as a percentage of gross domestic product (GDP). The GDP of a country is the total value of all goods and services produced within...
-
The data in the next column represent the percentage of 18- to 24-year-olds enrolled in college. Construct a time-series plot and comment on any trends. Year Percent Enrolled Year Percent Enrolled...
-
Nielsen/NetRatings is an Internet media and market research ï¬rm. One variable they measure is the amount of time an individual spends viewing a speciï¬c Web page. The following...
-
Transcribed image text
-
QUESTION 20 Assume a company reported the following results Sales Net operating income Average operating assets Margin Turnover Return on investment (ROI) 5300,000 2 $240.000 40% ? 2 What is the net...
-
2. Using the graph provided below, determine the fixed cost, the total variable cost, the variable cost per unit, and the TOTAL COST to produce 60 units. Fixed Cost ______________ Variable Cost...

Study smarter with the SolutionInn App


