

This is a repeated measures analysis with movement in nine people with Multiple Sclerosis at two timepoints
Question:
This is a repeated measures analysis with movement in nine people with Multiple Sclerosis at two timepoints (an intervention was given between pre-test and post-test). The hypothesis was that movement would be greater after the intervention. Look at the output:
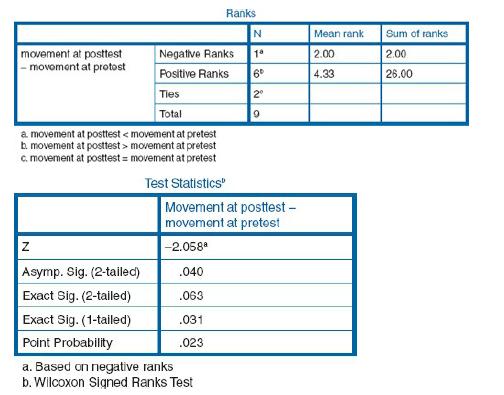
15. Which is the appropriate probability value to report?
a) .040
b) .063
c) .031
d) .023
Fantastic news! We've Found the answer you've been seeking!
Step by Step Answer:

Answered By
SADDAM HUSAIN
I have completed my graduation in electronics and telecommunication. currently i am preparing for GATE and Indian engineering services exam. i am active member of doubt solving platform like grade up and other educational Facebook group where i use to clear doubt of fellow aspirants.
0 Reviews
10+ Question Solved
Related Book For 
Statistics For The Health Sciences
ISBN: 9781849203364
1st Edition
Authors: Christine Dancey, John Reidy, Richard Rowe
Question Posted:
