A recent study in Great Britain examines the relationship between the number of friends an individual has
Question:

Figure 9.9

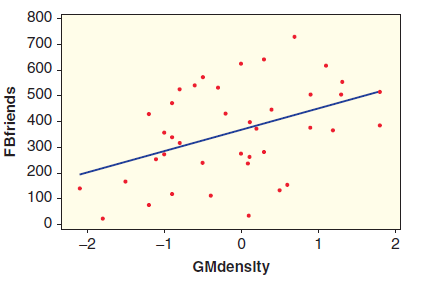
(a) Use the scatterplot to determine whether any of the study participants had grey matter density scores more than two standard deviations from the mean.
(b) Use the scatterplot to determine whether we should have any significant concerns about the conditions being met for using a linear model with these data.
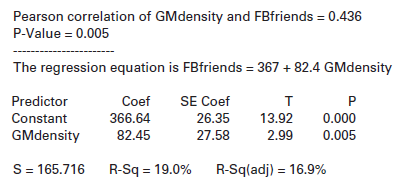
(c) What is the correlation between these two variables? What is the p-value from a test of the correlation? What is the conclusion of the test, in context?
(d) What is the least squares line to predict the number of Facebook friends based on the normalized grey matter density score? What number of Facebook friends is predicted for a person whose normalized score is 0? Whose normalized score is +1? Whose normalized score is ˆ’1?
(e) What is the p-value for a test of the slope? Compare it to the p-value for the test of correlation.
(f) What is R2 for this linear model? Interpret it in context.
Step by Step Answer:

Statistics Unlocking The Power Of Data
ISBN: 9780470601877
1st Edition
Authors: Robin H. Lock, Patti Frazer Lock, Kari Lock Morgan, Eric F. Lock, Dennis F. Lock


