Question:
Data 4.3 on page 224 describes a study of a possible relationship between the perceived malevolence of a team€™s uniforms and penalties called against the team. In Example 4.31 on page 270 we construct a randomization
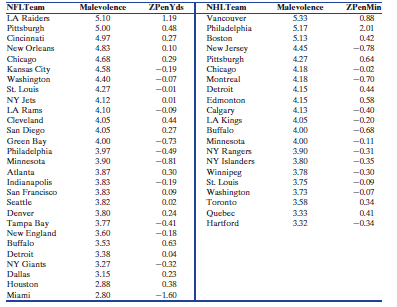
distribution to test whether there is evidence of a positive correlation between these two variables for NFL teams. The data in MalevolentUniformsNHL has information on uniform malevolence and penalty minutes (standardized as z-scores) for National Hockey League (NHL) teams. Use StatKey or other technology to perform a test similar to the one in Example 4.31 using the NHL hockey data. Use a 5% significance level and be sure to show all details of the test.
Data 4.3 on page 224
Frank and Gilovich describe a study of relationships between the type of uniforms worn by professional sports teams and the aggressiveness of the team. They consider teams from the National Football League (NFL) and National Hockey League (NHL). Participants with no knowledge of the teams rated the jerseys on characteristics such as timid/aggressive, nice/mean, and good/bad. The averages of these responses produced a €˜€˜malevolence€ index with higher scores signifying impressions of more malevolent (evil-looking) uniforms. To measure aggressiveness, the authors used the amount of penalties (yards for football and minutes for hockey) converted to z-scores and averaged for each team over the seasons from 1970 to 1986. The data are shown in Table 4.1 and stored in MalevolentUniformsNFL and MalevolentUniformsNHL.
Table 4.1

Distribution
The word "distribution" has several meanings in the financial world, most of them pertaining to the payment of assets from a fund, account, or individual security to an investor or beneficiary. Retirement account distributions are among the most...
Transcribed Image Text:
NFLTeam Malevolence 5.10 ZPenYds L19 NHLTeam Vancouver Philadelphia Boston Malevolence 533 ZPenMin LA Raiders Pittsburgh Cincinnati 0.88 5.00 0.48 5.17 2.01 5.13 4.45 4.97 0.27 0.42 New Orleans 4.83 a.10 New Jersey Pittsburgh Chicago Montreal -0.78 Chicago 4.68 0.29 4.27 0.64 Kansas City Washington 4.58 -0.19 4.18 -0.02 4.40 -0.07 4.18 -0.70 St. Louis Detroit 4.27 -001 4.15 0.44 NY Jets 4.12 a.01 Edmonton 4.15 0.58 LA Rams 4.10 -0.09 Calgary LA Kings 4.13 -0.40 Cleveland 4.05 0.44 4.05 -0.20 San Diego Green Bay Philadelphia 4.05 0.27 Buffalo 4.00 -0.68 4.00 -0.73 Minnesota 4.00 -0.11 3.97 -0.49 NY Rangers NY Islanders 3.90 -0.31 Minnesota 3.90 -081 3.80 -0.35 Winnipeg St. Louis Washington Toronto Atlanta 3.87 0.30 3.78 -0.30 Indianapolis 3.83 -019 3.75 -0.09 San Francisco 3.83 0.09 3.73 -0.07 Seattle 3.82 0.02 3.58 0.34 Denver 3.80 0.24 Quebec Hartford 333 0.41 -041 Tampa Bay New England Buffalo 3.77 332 -0.34 3.60 -a18 3.53 0.63 0.04 Detroit 3.38 NY Giants 3.27 -0.32 3.15 Dallas 0.23 Houston 2.88 0.38 Miami 2.80 -1.60


