

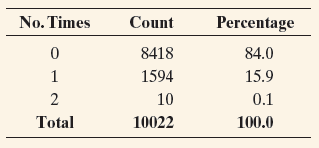
Question: The table below shows data (from a 2004 Bureau of the Census report) on the number of times 20- to 24-year-old men have been married.
The table below shows data (from a 2004 Bureau of the Census report) on the number of times 20- to 24-year-old men have been married.
a. Verify that the mean number of times men have been married is 0.16 and that the standard deviation is 0.37.
b. Find the actual percentages of observations within 1, 2, and 3 standard deviations of the mean. How do these compare to the percentages predicted by the empirical rule?
c. How do you explain the results in part b?
No. Times Count Percentage 8418 84.0 1 1594 15.9 10 0.1 10022 Total 100.0
Step by Step Solution
3.49 Rating (162 Votes )
There are 3 Steps involved in it
a b There are more observations within one standard deviation of the mean and fewer within two st... View full answer

Get step-by-step solutions from verified subject matter experts