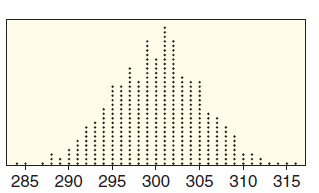
Using the sampling distribution shown in Figure 3.5(c), how likely are these sample means: Figure 3.5 c.
Question:
Figure 3.5
c.

(a) xÌ… = 250
(b) xÌ… = 305
(c) xÌ… = 315
Refer to the sampling distributions given in Figure 3.5. Several possible values are given for a sample statistic. In each case, indicate whether each value is
(i) Reasonably likely to occur from a sample of this size,
(ii) Unusual but might occur occasionally,
(iii) Extremely unlikely to ever occur.
DistributionThe word "distribution" has several meanings in the financial world, most of them pertaining to the payment of assets from a fund, account, or individual security to an investor or beneficiary. Retirement account distributions are among the most...
Fantastic news! We've Found the answer you've been seeking!
Step by Step Answer:
Related Book For 

Statistics, Enhanced Unlocking The Power Of Data
ISBN: 9781119308843
2nd Edition
Authors: Robin H Lock, Patti Frazer Lock, Kari Lock Morgan, Eric F Lock, Dennis F Lock
Question Posted:


