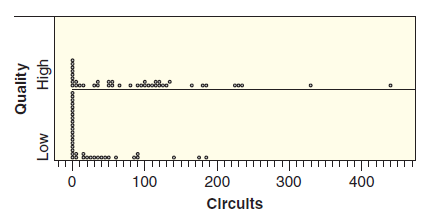
When honeybees are looking for a new home, they send out scouts to explore options. When a
Question:
Figure 2.47

(a) Does there appear to be an association between number of circuits in the waggle dance and the quality of the site? If so, describe the association.
(b) The five number summary for the number of circuits for those describing the high-quality site is (0, 7.5, 80, 122.5, 440), while the five number summary for those describing the low-quality site is (0, 0, 0, 42.5, 185). Use the IQR method to identify any outliers in either group. Justify your answer.
(c) The mean for the high-quality group is xÌ…H = 90.5 with a standard deviation of 94.6, while the mean for the low-quality group is xÌ…L = 30.0 with a standard deviation of 49.4. What is the difference in means, xÌ…H ˆ’ xÌ…L?
(d) Find the z-score for the largest value in the high quality group and the z-score for the largest value in the low-quality group. Which is larger relative to its group?
(e) Is it appropriate to use the 95% rule with either set of data?
Step by Step Answer:

Statistics Unlocking The Power Of Data
ISBN: 9780470601877
1st Edition
Authors: Robin H. Lock, Patti Frazer Lock, Kari Lock Morgan, Eric F. Lock, Dennis F. Lock


