When honeybee scouts find a food source or a nice site for a new home, they communicate
Question:
Distance.............Duration
200..........................0.40
250..........................0.45
500..........................0.95
950..........................1.30
1950........................2.00
3500........................3.10
4300........................4.10
(a) Which is the explanatory variable? Which is the response variable?
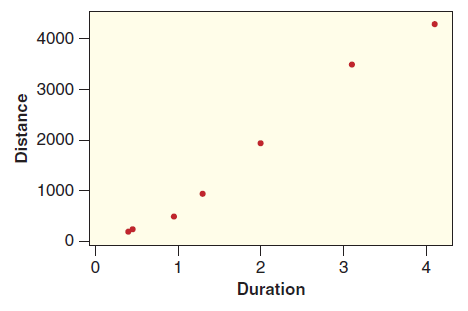
(b) Figure 2.69 shows a scatterplot of the data. Does there appear to be a linear trend in the data? If so, is it positive or negative?
Figure 2.69
 (c) Use technology to find the correlation between the two variables.
(d) Use technology to find the regression line to predict distance from duration.
(e) Interpret the slope of the line in context.
(f) Predict the distance to the site if a honeybee does a waggle dance lasting 1 second. Lasting 3 seconds.
Step by Step Answer:

Statistics Unlocking The Power Of Data
ISBN: 9780470601877
1st Edition
Authors: Robin H. Lock, Patti Frazer Lock, Kari Lock Morgan, Eric F. Lock, Dennis F. Lock


