

Question: Figure G-55 is a tectonic map of a region that contains three major shear zones that were active at different times. For each shear zone
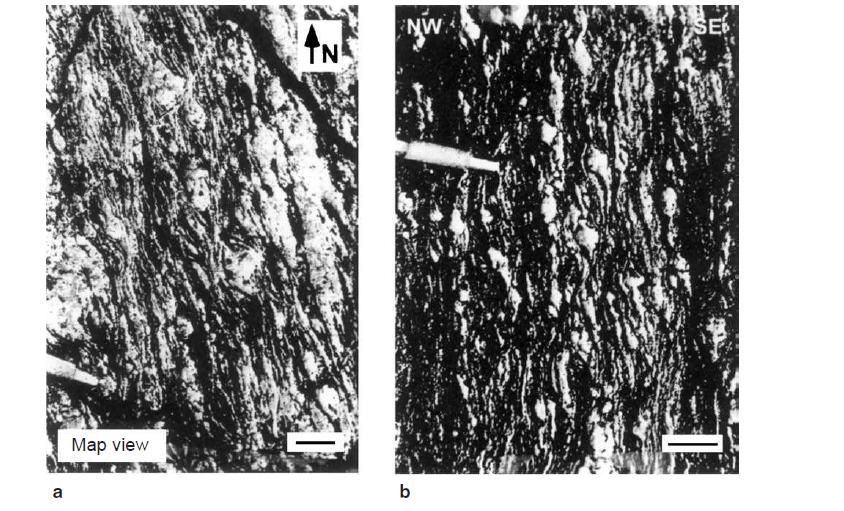
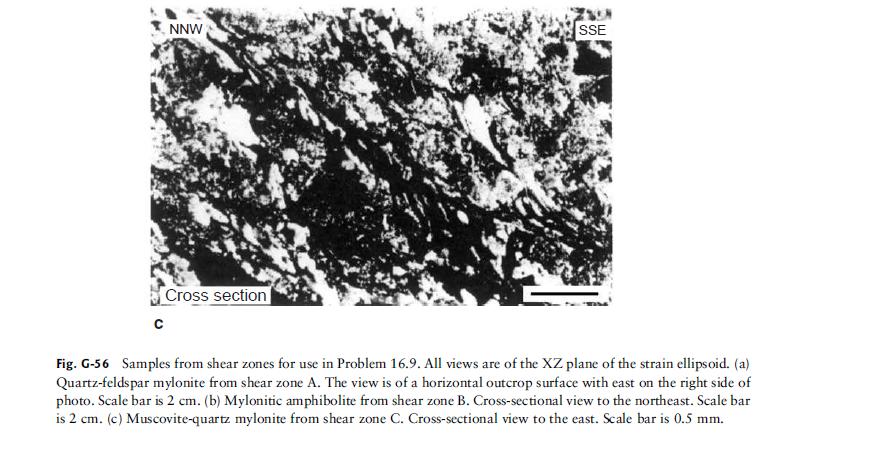
Figure G-55 is a tectonic map of a region that contains three major shear zones that were active at different times. For each shear zone a stereogram is provided that indicates the foliation and lineation orientations within the shear zone. Figure G-56a, b, and c are samples from shear zones A, B, and C, respectively. Use these figures to determine the type of movement in each shear zone. In one succinct paragraph, present the deformational history of the map area, summarizing the timing and style of each deformational event.
Fig. G-55
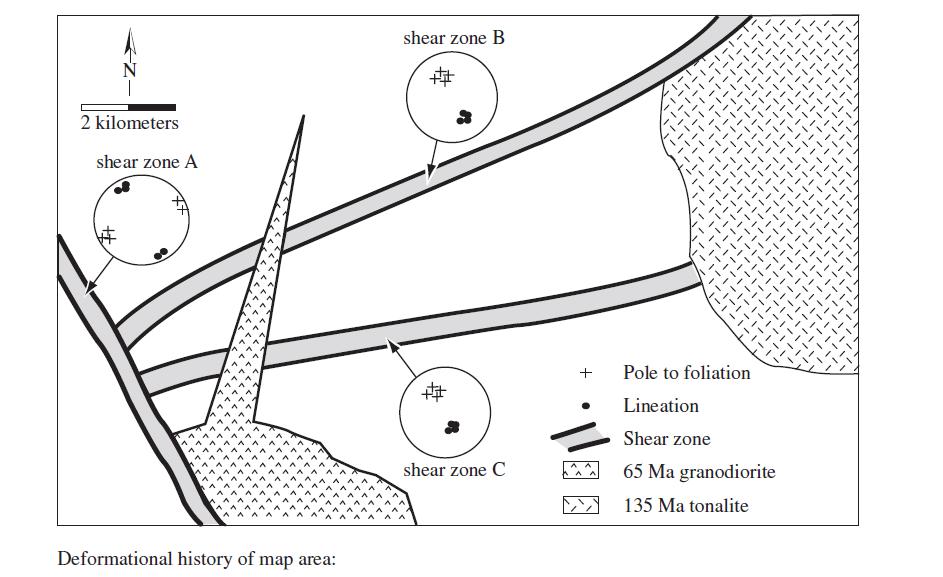
A-Z 2 kilometers shear zone A FF 17 19 7 7 1 Deformational history of map area: shear zone B # # shear zone C + Pole to foliation Lineation Shear zone 65 Ma granodiorite 135 Ma tonalite
Step by Step Solution
3.43 Rating (159 Votes )
There are 3 Steps involved in it

Get step-by-step solutions from verified subject matter experts