

Question: The data tabulated below were collected within the Basin-and-Range province, from faults in southern Nevada, and from north of Hoover Dam in the Lake Mead
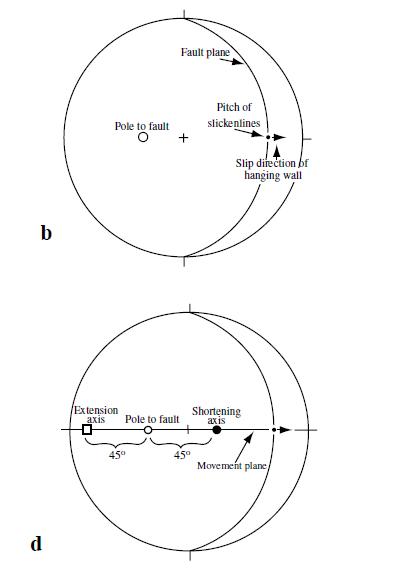
The data tabulated below were collected within the Basin-and-Range province, from faults in southern Nevada, and from north of Hoover Dam in the Lake Mead area. Although local exceptions exist, the overall extension direction in the Basin-and-Range province during the Tertiary was east–west. Construct one plot showing the orientations of faults, pitch of slickenlines, and slip directions (as in Fig. 10.6b). Construct a second plot that shows the extension and shortening axes (as in Fig. 10.6d). There are not enough data to contour, so visually determine the ‘‘best fit’’ extension axis direction (or directions, if there are more than one).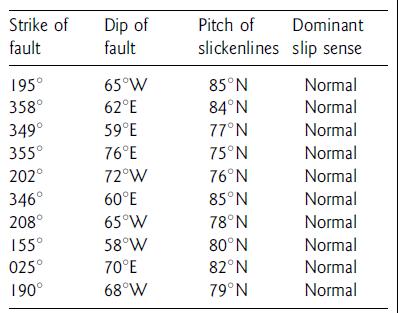
Are these data from the Lake Mead area consistent with the regional extension direction in the Basinand- Range province as a whole? (In reality, many more data points would be needed to rigorously address this question.)
Fig. 10.6b,d
Strike of fault 195 358 349 355 202 346 208 155 025 190 Dip of fault 65W 62E 59E 76E 72W 60E 65W 58W 70E 68W Pitch of slickenlines 85N 84N 77N 75N 76N 85N 78N 80N 82N 79N Dominant slip sense Normal Normal Normal Normal Normal Normal Normal Normal Normal Normal
Step by Step Solution
3.30 Rating (162 Votes )
There are 3 Steps involved in it
To address your question we will follow these steps Step 1 Plotting Fault Orientations and Slickenlines 1 Plot Fault Orientations Each fault is define... View full answer

Get step-by-step solutions from verified subject matter experts