

10. (***) (Microsoft Excel problem). The following figure shows an Excel spreadsheet that calculates weighted X and...
Question:
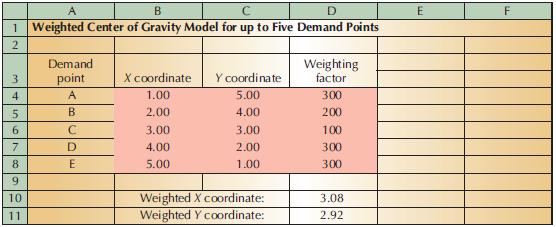
10. (***) (Microsoft Excel problem). The following figure shows an Excel spreadsheet that calculates weighted X and Y coordinates, based on values for up to five demand points. Re-create this spreadsheet in Excel.
While your formatting does not have to be exactly the same, your answers should be. Your spreadsheet should recalculate results whenever any changes are made to the shaded cells. To test your logic, change the weight on demand point D to 300. Your new weighted X and Y coordinates should be 3.08 and 2.92, respectively.
Fantastic news! We've Found the answer you've been seeking!
Step by Step Answer:

Answered By
Carly Cimino
As a tutor, my focus is to help communicate and break down difficult concepts in a way that allows students greater accessibility and comprehension to their course material. I love helping others develop a sense of personal confidence and curiosity, and I'm looking forward to the chance to interact and work with you professionally and better your academic grades.
12+ Reviews
21+ Question Solved
Related Book For 

Introduction To Operations And Supply Chain Management
ISBN: 9780131791039
2nd Edition
Authors: Cecil C. Bozarth, Robert B. Handfield
Question Posted:
