

26. (***) (Microsoft Excel Problem). The following figure shows an Excel spreadsheet that calculates the benefit of
Question:
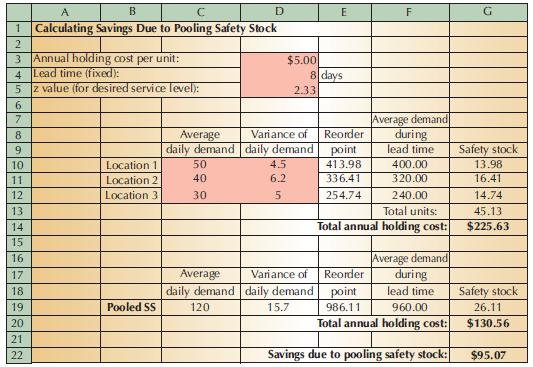
26. (***) (Microsoft Excel Problem). The following figure shows an Excel spreadsheet that calculates the benefit of pooling safety stock. Specifically, the sheet calculates how much could be saved in annual holding costs if the safety stocks for three locations were held in a single location.
Re-create this spreadsheet in Excel. You should develop the spreadsheet so that the results will be recalculated if any of the values in the highlighted cells are changed.
Your formatting does not have to be exactly the same, but the numbers should be. (As a test, see what happens if you change Location 1’s average daily demand and variance of daily demand to 100 and 15, respectively. Your new pooled safety stock should be 30.34, and the total savings due to pooling safety stock should be $108.21.)
Step by Step Answer:


Introduction To Operations And Supply Chain Management
ISBN: 9780131791039
2nd Edition
Authors: Cecil C. Bozarth, Robert B. Handfield
