

An electrocardiogram (ECG) is a valuable diagnostic tool used in cardiovascular medicine. The ECG is based on
Question:
An electrocardiogram (ECG) is a valuable diagnostic tool used in cardiovascular medicine. The ECG is based on the fact that the heart emits measurable bioelectric signals that can be recorded to evaluate the functioning of the heart as a mechanical pump. These signals were first observed in the late 19th century, and subsequent signal processing developments have led to the advanced technology of present-day ECG equipment.
The bioelectric signals of the heart muscle are measured and recorded through the placement of skin electrodes at various sites on the surface of the body. The site selection as well as discussion of the functions of the cardiac muscle are beyond the scope of this example. Rather, our purpose is to introduce some of the useful partial descriptors of ECG waveforms.
In bioelectric terminology the normal ECG waveform in Figure 5–45 is composed of a P wave, a QRS complex, and a T wave. This sequence of pulses depicts the electrical activity that stimulates the correct functioning of the cardiac muscle. The flat baseline between successive events is called
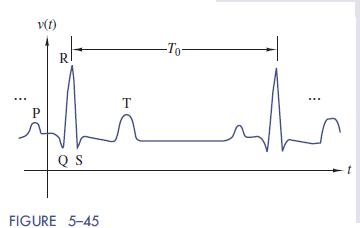
isoelectric, which means there is no bioelectric activity and the heart muscle returns to a resting state. The body’s natural pacemaker produces a nominally periodic waveform under the resting conditions used with ECG tests.
Partial waveform descriptors used to analyze ECG waveforms include:
1. The heart rate ð1=T0Þ, which is normally between 60 and 100 beats per minute.
2. The PR interval (normally 0.12–0.20 seconds), which is the time between the start of the P wave and the start of the QRS complex.
3. The QRS interval (normally 0.06–0.10 seconds), which is the time between onset and end of the QRS complex.
4. The ST segment is the signal level between the end of the QRS complex and the start of the T wave. This level should be the same as the isoelectric baseline between successive pulses.
Departures from these normal conditions serve as diagnostic tools in cardiovascular medicine. Some of the abnormal waveform features of concern include an irregular heart rate, a missing P wave, a prolonged QRS interval, or an elevated ST segment.
Departures from nominal conditions allow the trained clinician to diagnose the situation, especially when abnormal features occur in certain combinations. However, it is not our purpose to discuss the medical interpretation of ECG waveform abnormalities.
Rather, this example illustrates that bioelectric signals carry information and that the information is decoded by analyzing the signal’s partial waveform descriptors.
Step by Step Answer:


The Analysis And Design Of Linear Circuits
ISBN: 9781119235385
8th Edition
Authors: Roland E. Thomas, Albert J. Rosa, Gregory J. Toussaint
