Refer to Practice Problem 15. The accompanying data are the values of mosquito activation (fraction of 50
Question:
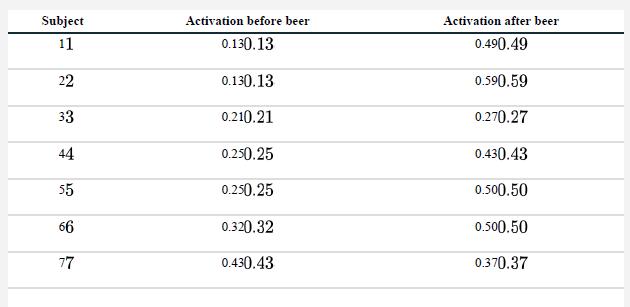
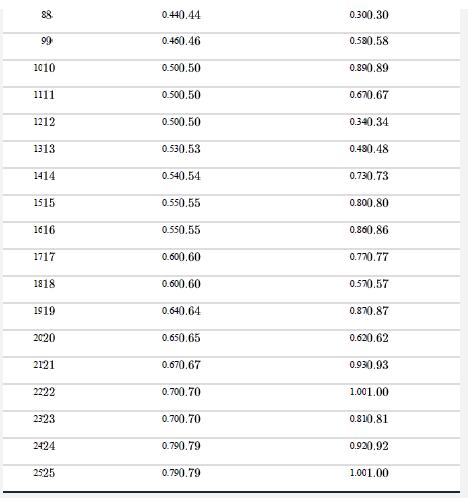
Refer to Practice Problem 15. The accompanying data are the values of mosquito activation (fraction of 50 mosquitos that left the container) recorded on the 25 participants before and after drinking one liter of the local beer.
a. Construct a graph illustrating the changes in mosquito activation. What trend is suggested?
b. Comment on the graph in relation to the assumptions needed to carry out a test.
c. Test whether mean activation of mosquitoes changed after consumption of beer.
d. How big is the effect of beer on activation? Construct a 95% confidence interval.


Data from problem 15
Mosquitoes find their victims in part by odor, so it makes sense to wonder whether what we eat and drink influences our attractiveness to mosquitoes. A study in West Africa (Lefèvre et al. 2010), working with the mosquito species that carry malaria, wondered whether drinking the local beer influenced attractiveness to mosquitoes.
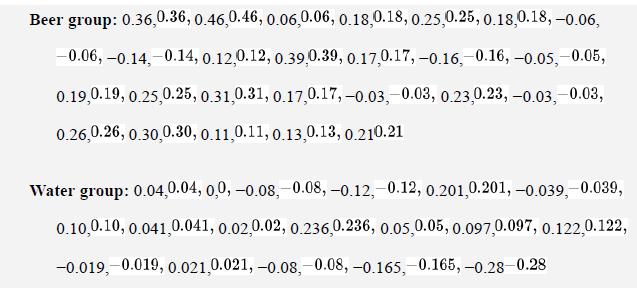
They opened a container holding 50 mosquitoes next to each of 25 alcohol-free participants and measured the proportion of mosquitoes that left the container and flew toward the participants (they called this proportion the “activation”). They repeated this procedure 15 minutes after each of the same participants had consumed a liter of beer and measured the “change in activation” (after minus before). This procedure was also carried out on another 18 human participants who were given water instead of beer.
The change in activation of mosquitoes is given for both the beer- and water-drinking groups:

Step by Step Answer:

The Analysis Of Biological Data
ISBN: 9781319226237
3rd Edition
Authors: Michael C. Whitlock, Dolph Schluter


