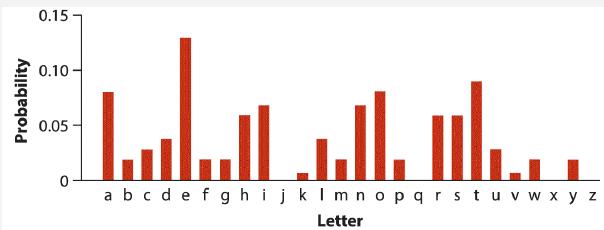
The accompanying bar graph gives the relative frequency of letters in texts from the English language. Such
Question:
The accompanying bar graph gives the relative frequency of letters in texts from the English language. Such charts are useful for deciphering simple codes.
a. If a letter were chosen at random from a book written in normal English, estimate by eye (and a bit of calculation) the probability that it is a vowel (i.e., A, E, I, O, or U).
b. Estimate by eye the probability that five letters chosen independently and at random from an English text would spell out (in order) “S-T-A-T-S.”
c. Estimate by eye the probability that two letters chosen at random from an English text are both E’s.

Fantastic news! We've Found the answer you've been seeking!
Step by Step Answer:
Related Book For 

The Analysis Of Biological Data
ISBN: 9781319226237
3rd Edition
Authors: Michael C. Whitlock, Dolph Schluter
Question Posted:


