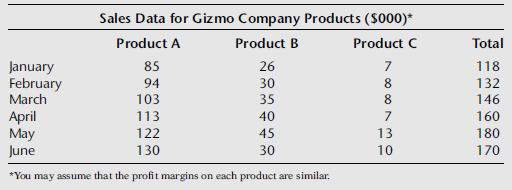
1. Review the quantitative data that follow. You will see that you can make several conclusions based...
Question:
1. Review the quantitative data that follow. You will see that you can make several conclusions based on these data. What do you see? Select one type of comparison (part to whole, time series, etc.) and roughly sketch out a slide to support the conclusion you have drawn from the comparison. (You do not need to use all of the data.) Write a title for the slide that captures the
“so what?” of the graph.

Step by Step Answer:
Related Book For 

Question Posted:


