

Question: Calculate mean squared error (MSE), and mean absolute percentage error (MAPE) for the forecasts obtained in Example 19.2 using a= 0.5. These measures are shown
Calculate mean squared error (MSE), and mean absolute percentage error (MAPE) for the forecasts obtained in Example 19.2 using a= 0.5.
These measures are shown calculated in Table 19.3.
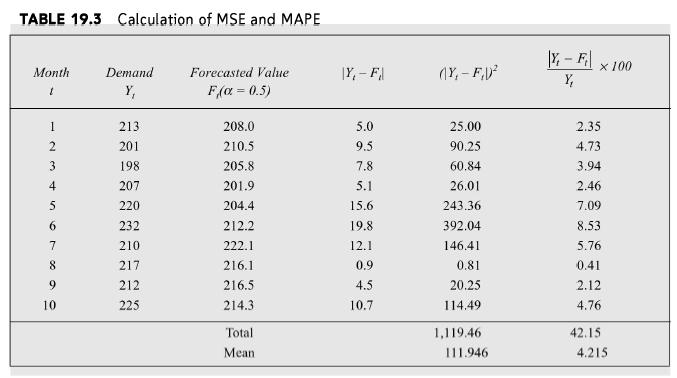
TABLE 19.3 Calculation of MSE and MAPE Y-F Month Demand Forecasted Value |Y-F\ (Y,-FV) x 100 Y Y, F,(= 0.5) 1 213 208.0 5.0 25.00 2.35 2 201 210.5 9.5 90.25 4.73 3 198 205.8 7.8 60.84 3.94 4 207 201.9 5.1 26.01 2.46 5 220 204.4 15.6 243.36 7.09 10 67890 232 212.2 19.8 392.04 8.53 210 222.1 12.1 146.41 5.76 217 216.1 0.9 0.81 0.41 212 216.5 4.5 20.25 2.12 225 214.3 10.7 114.49 4.76 Total 1,119.46 42.15 Mean 111.946 4.215
Step by Step Solution
There are 3 Steps involved in it

Get step-by-step solutions from verified subject matter experts