

The table below shows a business plan to put items on sale. Shown are the original price
Question:
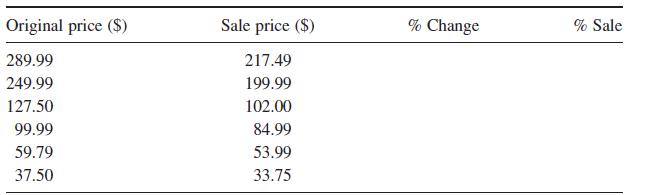
The table below shows a business plan to put items on sale. Shown are the original price and the sale price of a list of items. Calculate the percent change of all the items to the nearest percent and put these numbers in the empty percent change locations in the table. Calculate the percent sale numbers (% Sale = 100 − % Change). Then plot a graph of these data, placing the original price on the horizontal axis and the percent sale on the vertical axis.
Step by Step Answer:

This question has not been answered yet.
You can Ask your question!
Related Book For 

Understanding The Mathematics Of Personal Finance An Introduction To Financial Literacy
ISBN: 9780470497807
1st Edition
Authors: Lawrence N. Dworsky
Question Posted:
