Go back

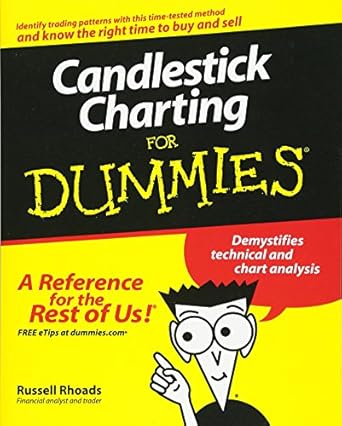
Candlestick Charting For Dummies(1st Edition)

Authors:

Russell Rhoads

Free candlestick charting for dummies 1st edition russell rhoads 0470178086, 978-0470178089
12 ratings
Cover Type:Hardcover
Condition:Used

In Stock

Shipment time

Expected shipping within 2 Days
Access to 30 Million+ solutions Free
Ask 50 Questions from expert AI-Powered Answers
7 days-trial

Total Price:

$0

List Price: $16.95 Savings: $16.95(100%)
Access to 30 Million+ solutions
Ask 50 Questions from expert AI-Powered Answers 24/7 Tutor Help Detailed solutions for Candlestick Charting For Dummies

Price:

$9.99

/month

Book details

ISBN: 0470178086, 978-0470178089

Book publisher: For Dummies

Get your hands on the best-selling book Candlestick Charting For Dummies 1st Edition for free. Feed your curiosity and let your imagination soar with the best stories coming out to you without hefty price tags. Browse SolutionInn to discover a treasure trove of fiction and non-fiction books where every page leads the reader to an undiscovered world. Start your literary adventure right away and also enjoy free shipping of these complimentary books to your door.

Book Summary: Want To Gain A Trading Edge With Candlestick Charts? Find Them A Little Confusing? No Worries! Candlestick Charting For Dummies Sheds Light On This Time-tested Method For Finding The Perfect Moment To Buy Or Sell. It Demystifies Technical And Chart Analysis And Gives You The Tools You Need To Identify Trading Patterns — And Pounce! This Friendly, Practical, Guide Explains Candlestick Charting And Technical Analysis In Plain English. In No Time, You’ll Be Working With Common Candlestick Patterns, Analyzing Trading Patterns, Predicting Market Behavior, And Making Your Smartest Trades Ever. You’ll Discover The Advantages Candlestick Has Over Other Charting Methods And Learn The Secrets Of Combining It With Other Technical Indicators. You’ll Also Get Familiar With Different Ways To Display And Interpret Price Action, Including Trend Lines, Support Levels, Resistance Levels, Moving Averages, And Complex Indicators. Discover How To:Construct Candlestick ChartsIdentify And Interpret Basic PatternsTrade In Bull And Bear MarketsWork With Complex Patterns And IndicatorsAvoid False SignalsUnderstand The Components Of Market ActivityDeal With Bullish Or Bearish Single-stick, Two Stick, And Multistick PatternsIdentify And Interpret Complex PatternsUse Indicators To Determine The MarketOutperform The Market In Any ConditionsDon’t Know Whether To Grab The Bull By The Horns Or Just Grin And Bear It? Read Candlestick Charting For Dummies And Get It Right The First Time.