

Question: Vapor-liquid equilibrium data at 101.3 kPa are given for the chloroform-methanol system. From these data, prepare plots like Figures 4.6b and 4.6c. From the plots,
Vapor-liquid equilibrium data at 101.3 kPa are given for the chloroform-methanol system. From these data, prepare plots like Figures 4.6b and 4.6c. From the plots, determine the azeotropic composition and temperature at 101.3 kPa. Is the azeotrope of the minimum- or maximum-boilingtype?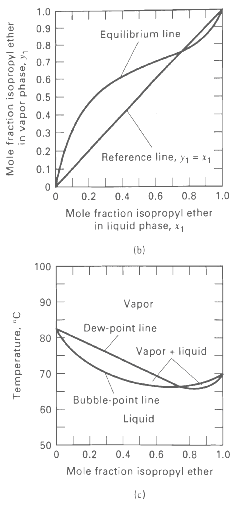
1.0 0.9 Equilibrium line 0.8 0.7E 0.6E 0.5 0.4 0.3 0.2 Reference line, y1 = 11 0.1 F 0.6 0.8 1.0 0.2 0.4 Mole fraction isopropyl ether in liquid phase, x1 (b) 100 90 Vapor Dew-point line 80 Vapor liquid 70 Bubble-point line 50 Liquid 50 0.2 0.4 0.6 0.8 1.0 Mole fraction isopropyl ether Mole fraction isopropyl ether in vapor phase, y, Temperature, "C
Step by Step Solution
3.36 Rating (159 Votes )
There are 3 Steps involved in it
See plots below From these plots a minimumboiling azeo... View full answer

Get step-by-step solutions from verified subject matter experts
Document Format (1 attachment)
37-E-C-E-S-P (102).docx
120 KBs Word File